Aims
Create a set of map tiles with custom colors, borders, fonts, etc, and host it on GitHub for use in personal projects.
- Design a map on Mapbox (or import map styles to Mapbox from another tool)
- Download the map tiles using a Python script
- Host the map on GitHub
Bonus: demo your new map tiles in action using Leaflet.js.
Limitations
- This process works best for maps that have limited scope and zoom levels (e.g. a single country with high zoom detail, or the entire world with low zoom detail). This is because the more map tiles you export, the quicker you'll run out of free Mapbox API credits & increasing your zoom levels exponentially increases your API usage.
- If you choose to host the map on GitHub, anyone else will be able to use it as it is available publicly. Consider using a different hosting solution if you'd like the map to be private / only accessible with authentication.
- The map will not update with new chartography data unless you re-export it from Mapbox.
Alternatives
- TileMill - ran locally, requires PostgreSQL / Node, doesn't have the Mapbox styling interface. I've not investigated this one yet as it looks a fair bit older.
- QGIS - you can import MapBox maps into this software, then use QTiles to export them as tiles again. However, the image quality is reduced and random tiles will have a single pixel white line drawn vertically through them. There's not a noticeable improvement in tile download speed, and the map typography doesn't scale well (seems twice as small as it should be). QGIS + QTiles might work better with map styles not imported from Mapbox, however I've not yet tested to confirm this.
Requirements
You'll need a Mapbox account that hasn't reached its free tier API limits, a GitHub account, and a computer that can run Python scripts.
Instructions
Design a map on Mapbox
If you don't have a Mapbox account, sign up for one.
Next, navigate to Mapbox studio, and create a new map style.
If you're new to Mapbox, I'd recommend creating a new map style based on an image - this will set a lot of the color options for you, saving you some effort setting up.
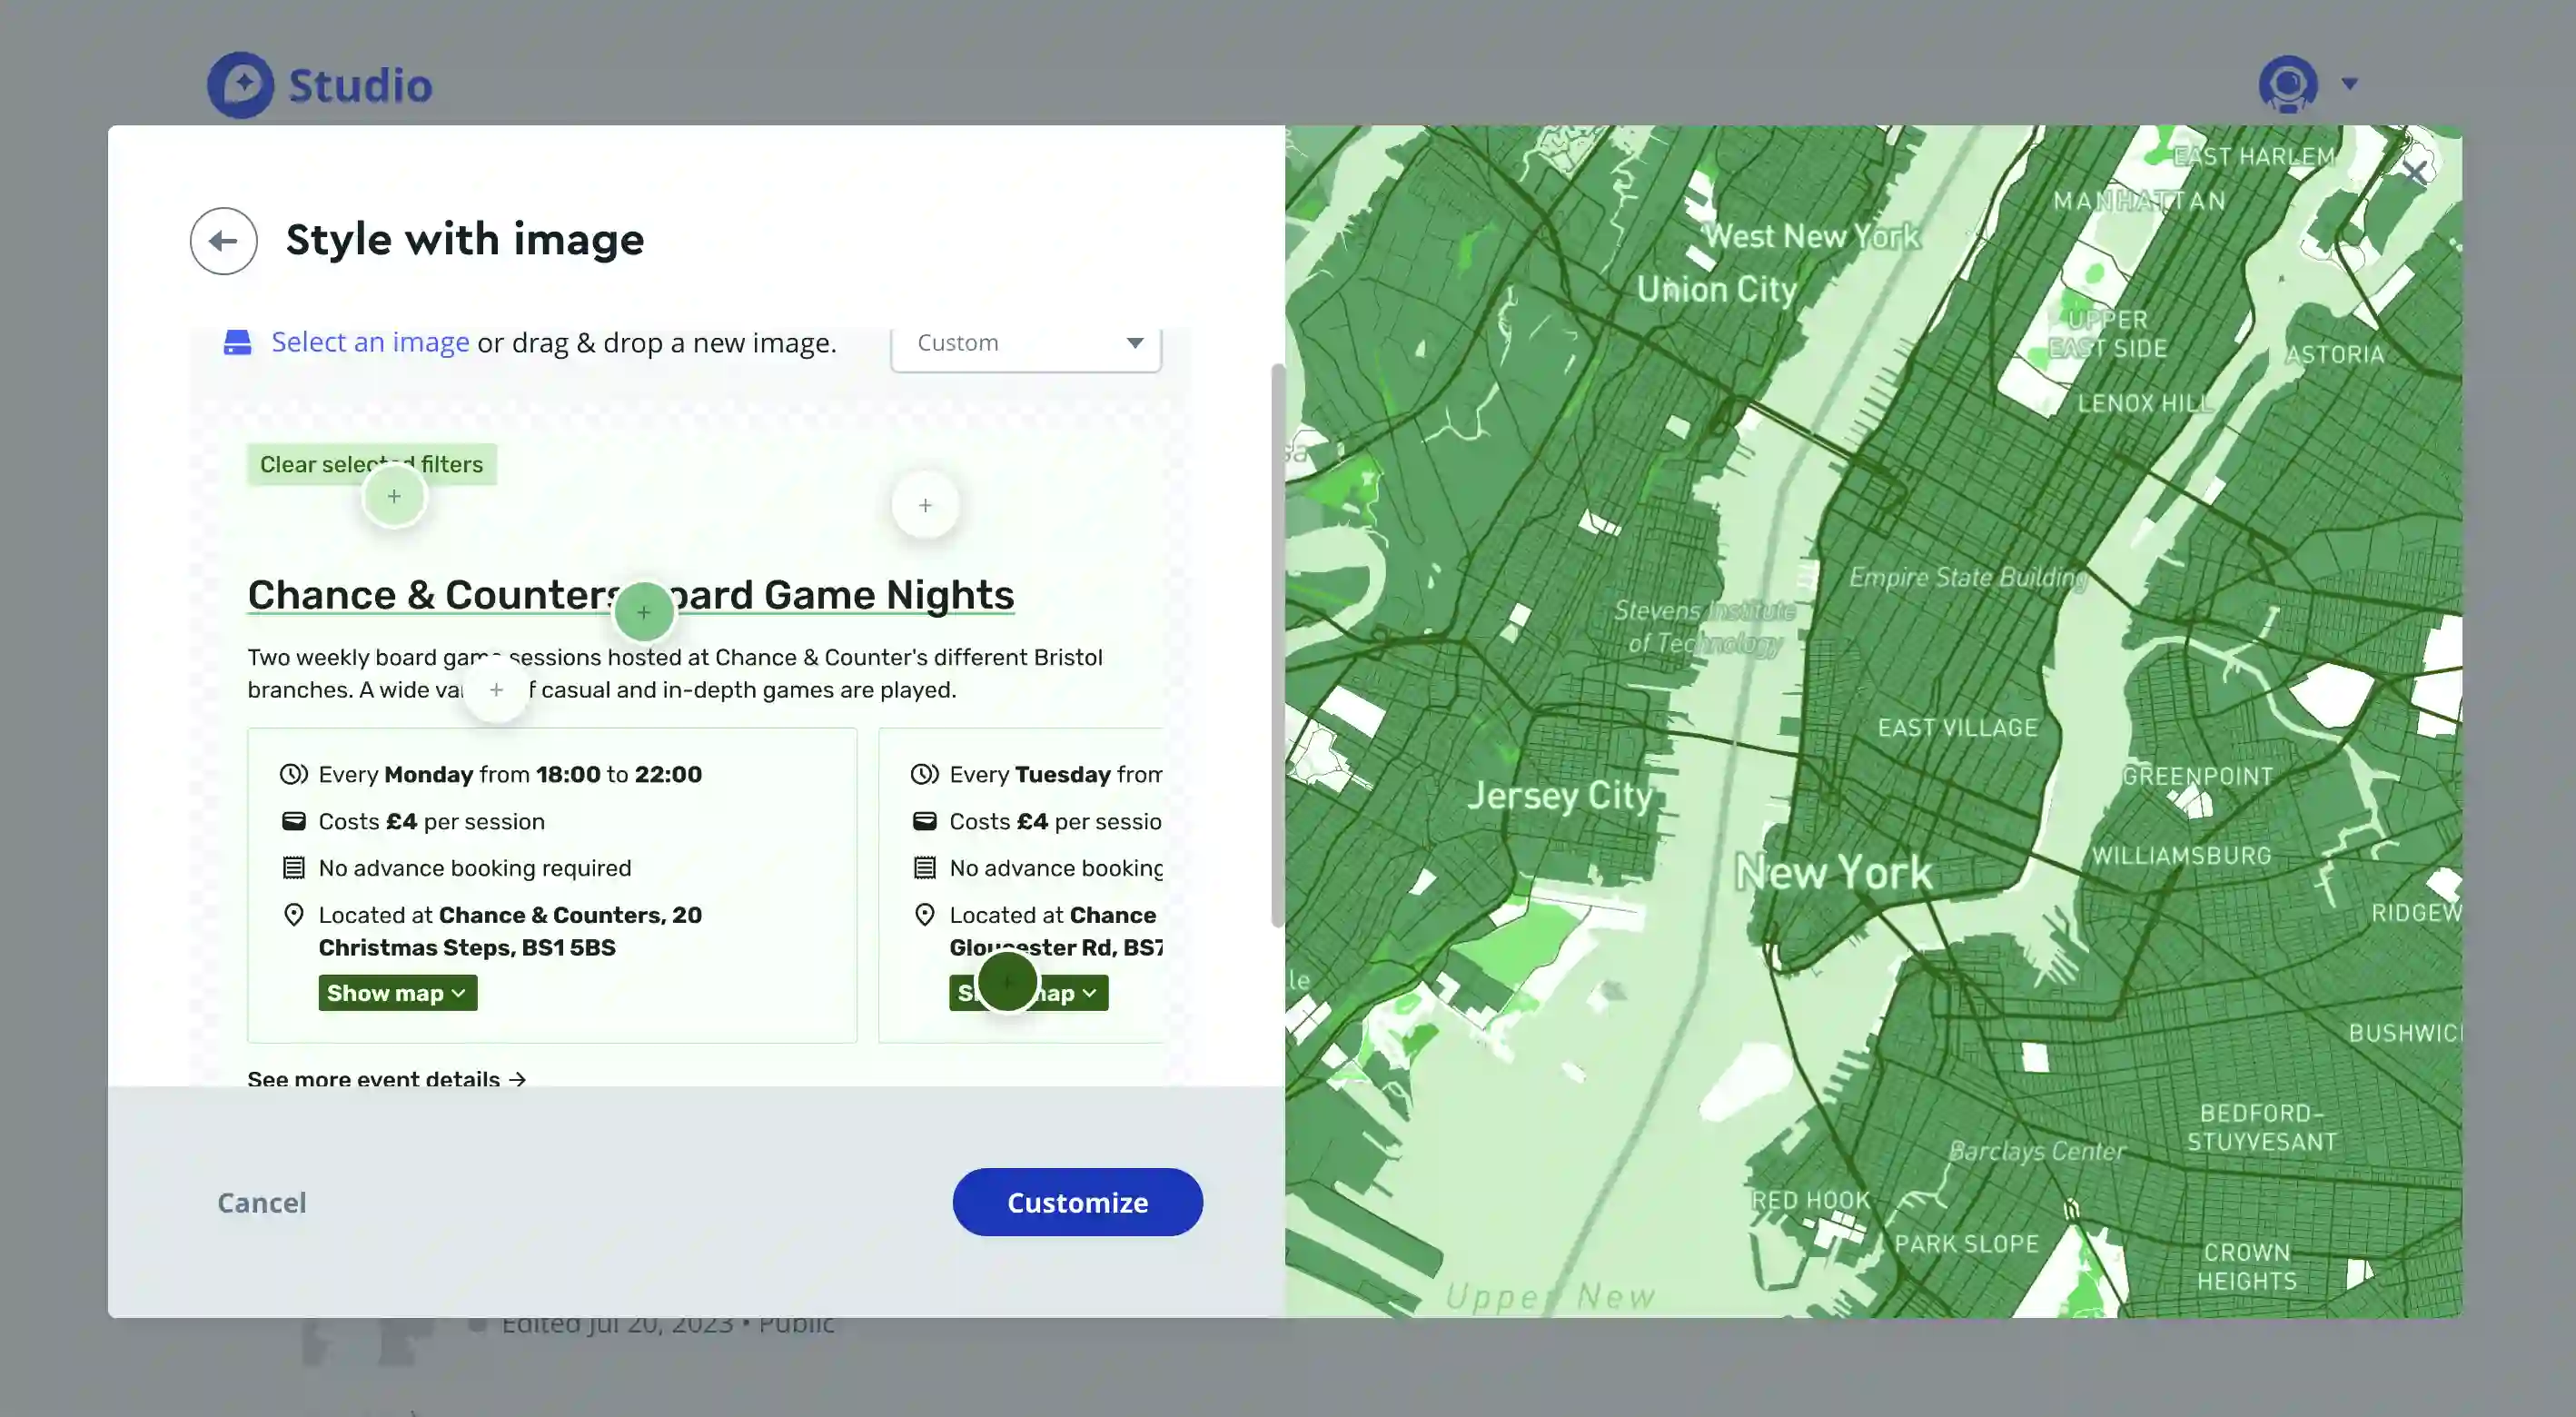
Click customize to continue and edit the map style further.
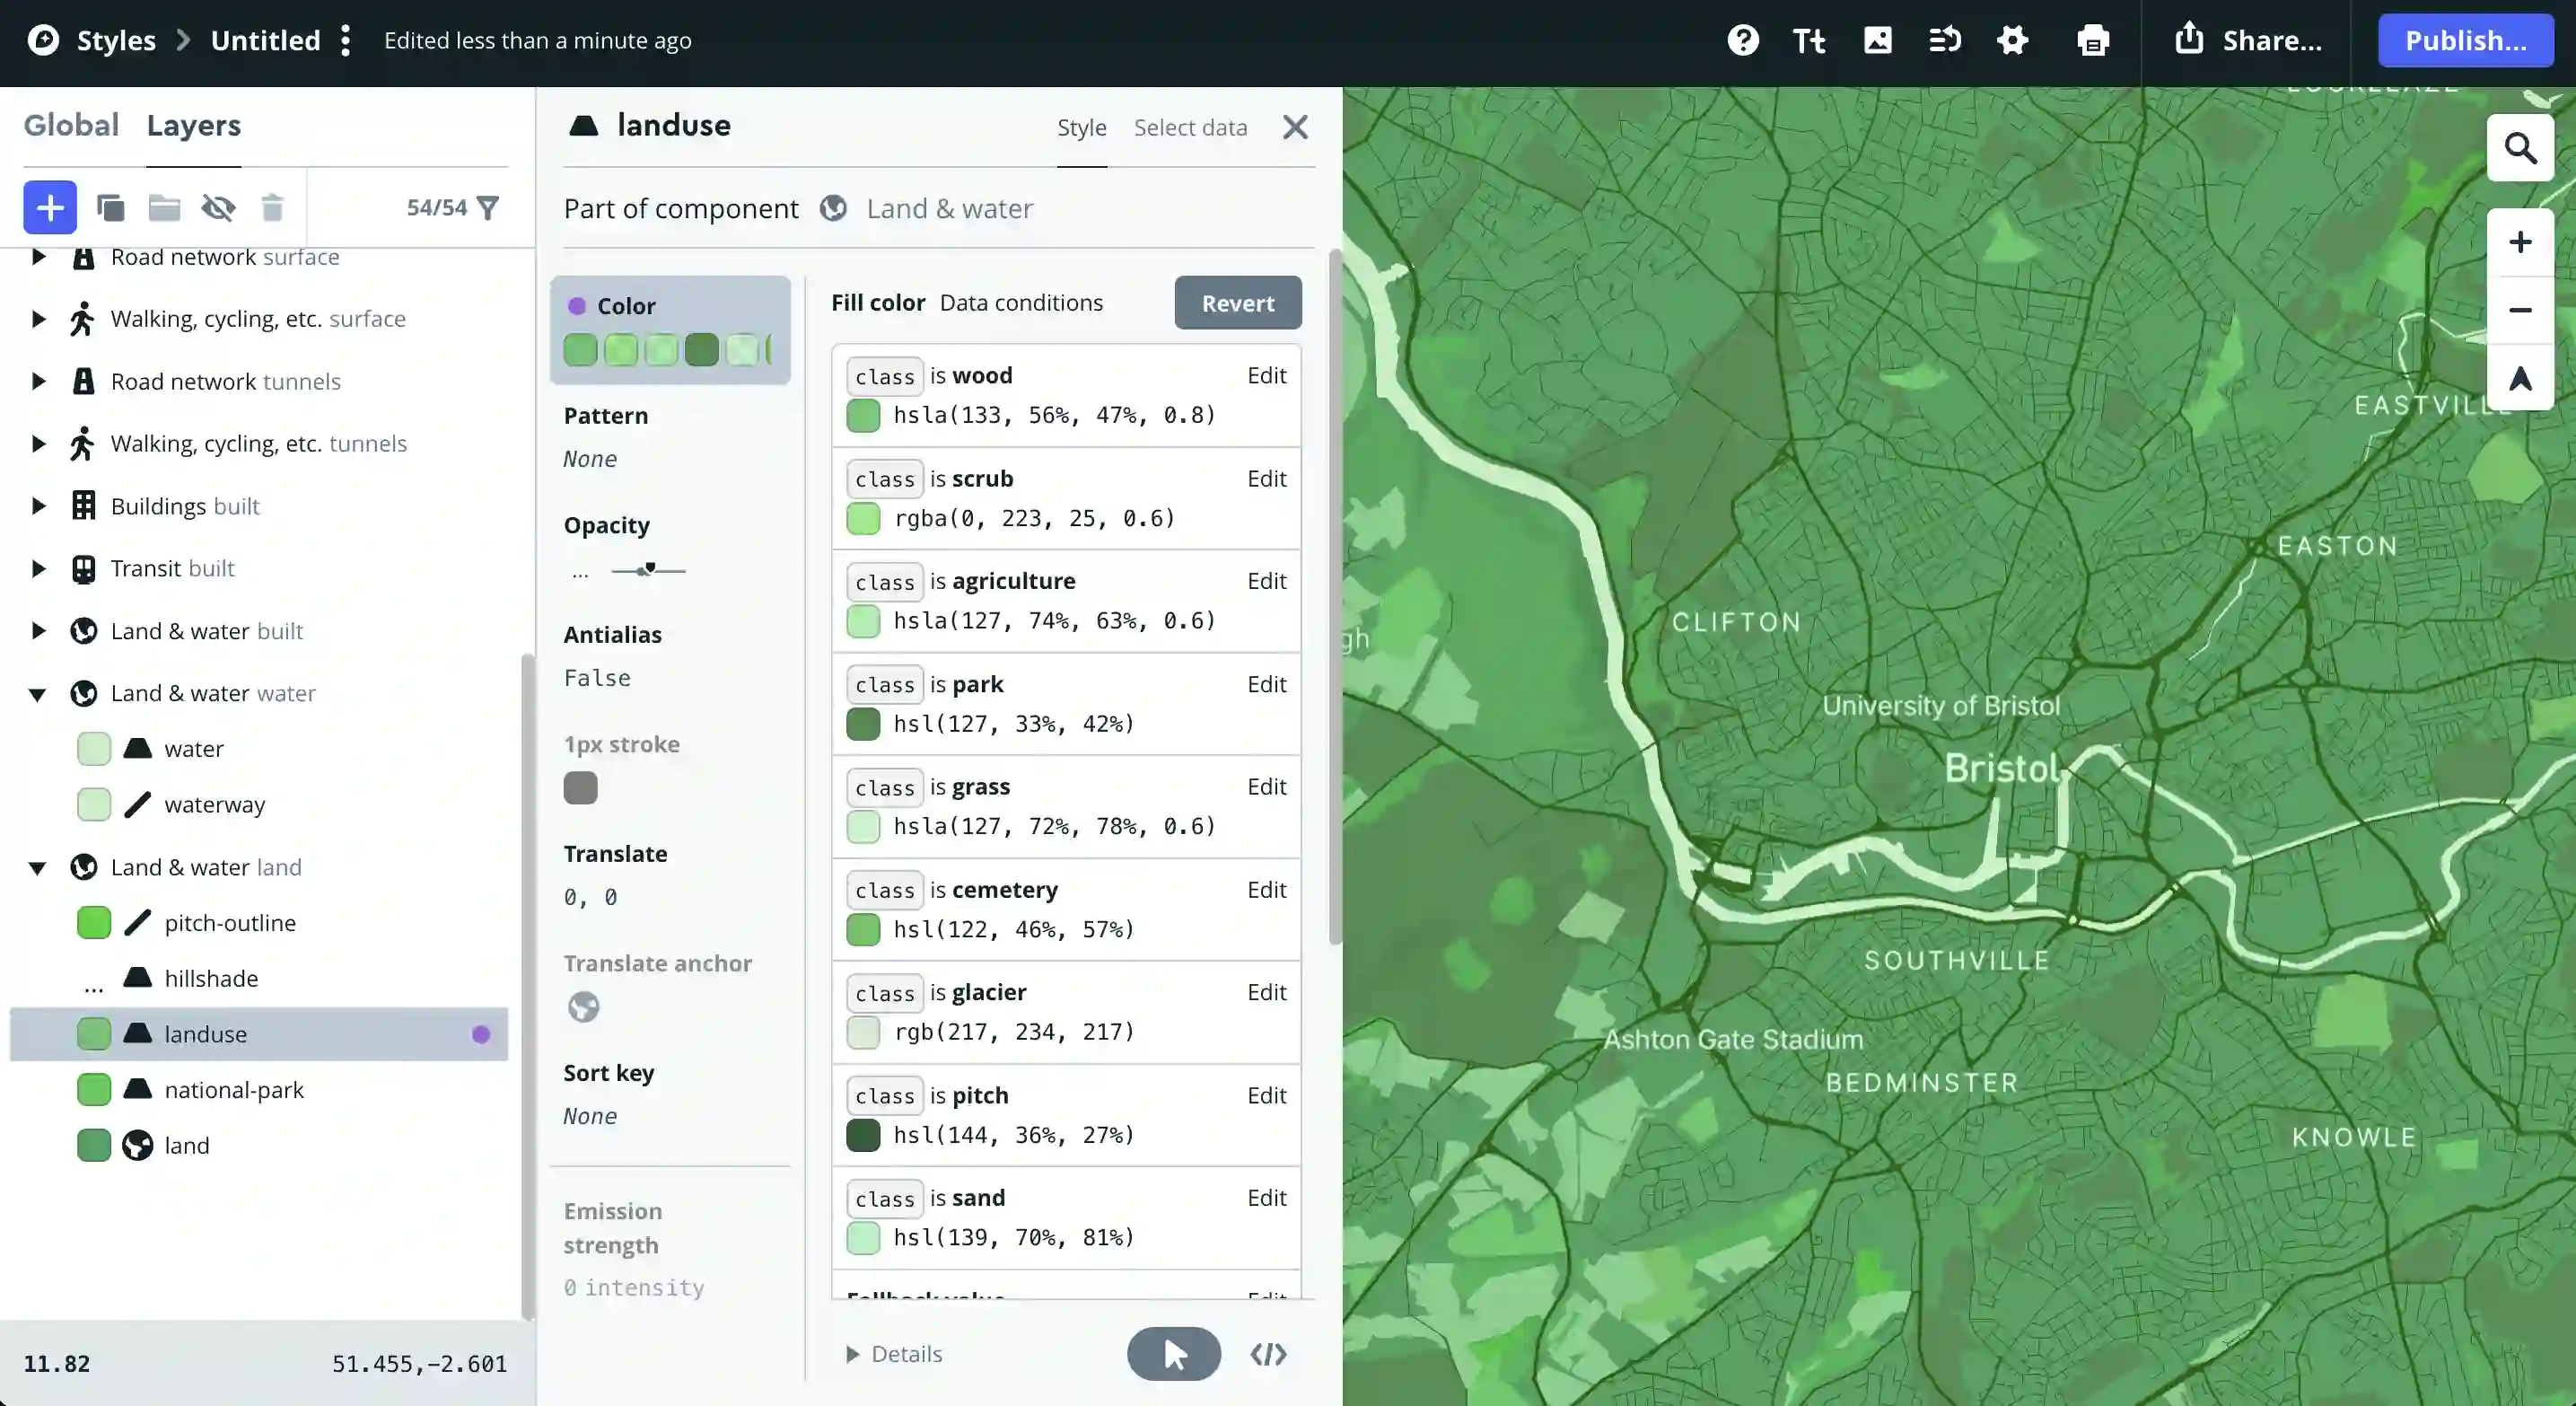
To change the colors of elements on the map, click on that element. You may then have to navigate to the specific item within the layer you'd like to change the color of (e.g. changing the base color of landuse won't change all the land colors - scroll through the options to find the specific class of land use color you'd like to change).
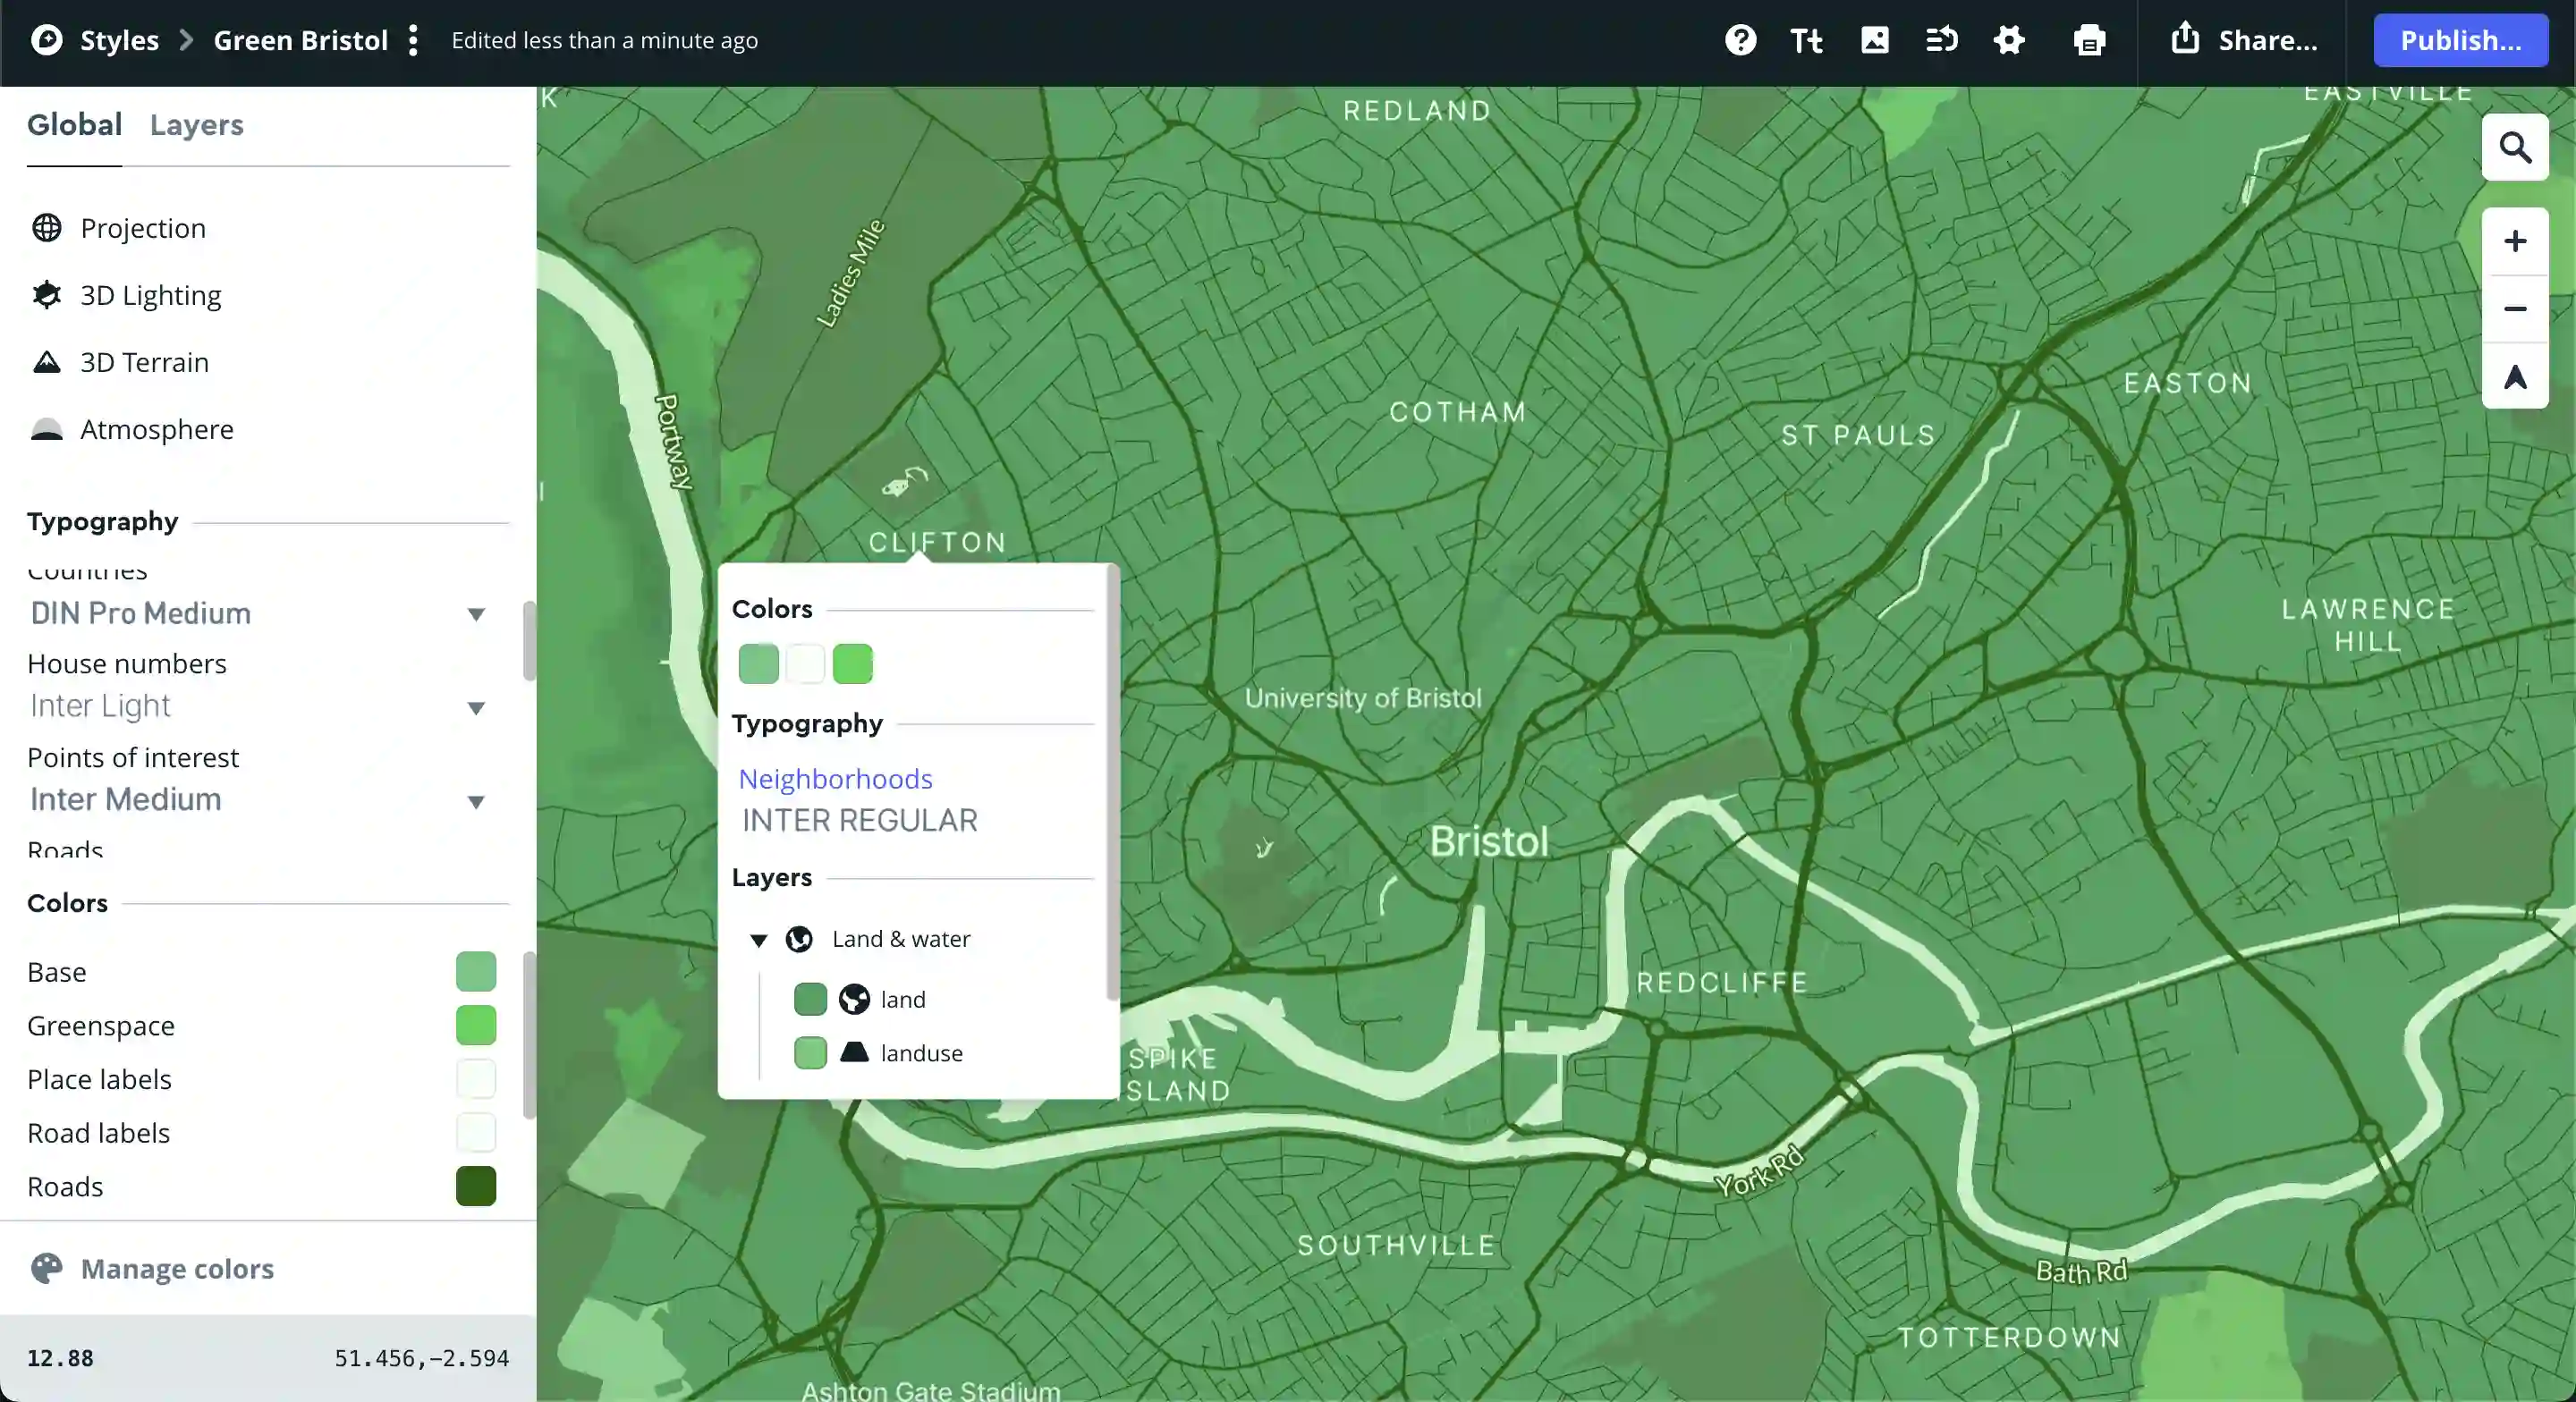
Typography for the map can be updated in a similar way, by clicking on the map titles. Make sure to zoom in and out so you update titles and map colors that only render at certain zoom levels.
Consider following further Mapbox tutorials to familiarize yourself with the user interface and have greater control over how you customize the map.
Once you are happy with the map design, click the publish button in the top right.
To download the tiles, you'll need an API URL with your access token. To get this, click "Share" in the top right, then scroll down to developer resources. Select "Third party", then in the dropdown directly beneath, select "Fulcrum" and copy the integration URL provided by Mapbox.
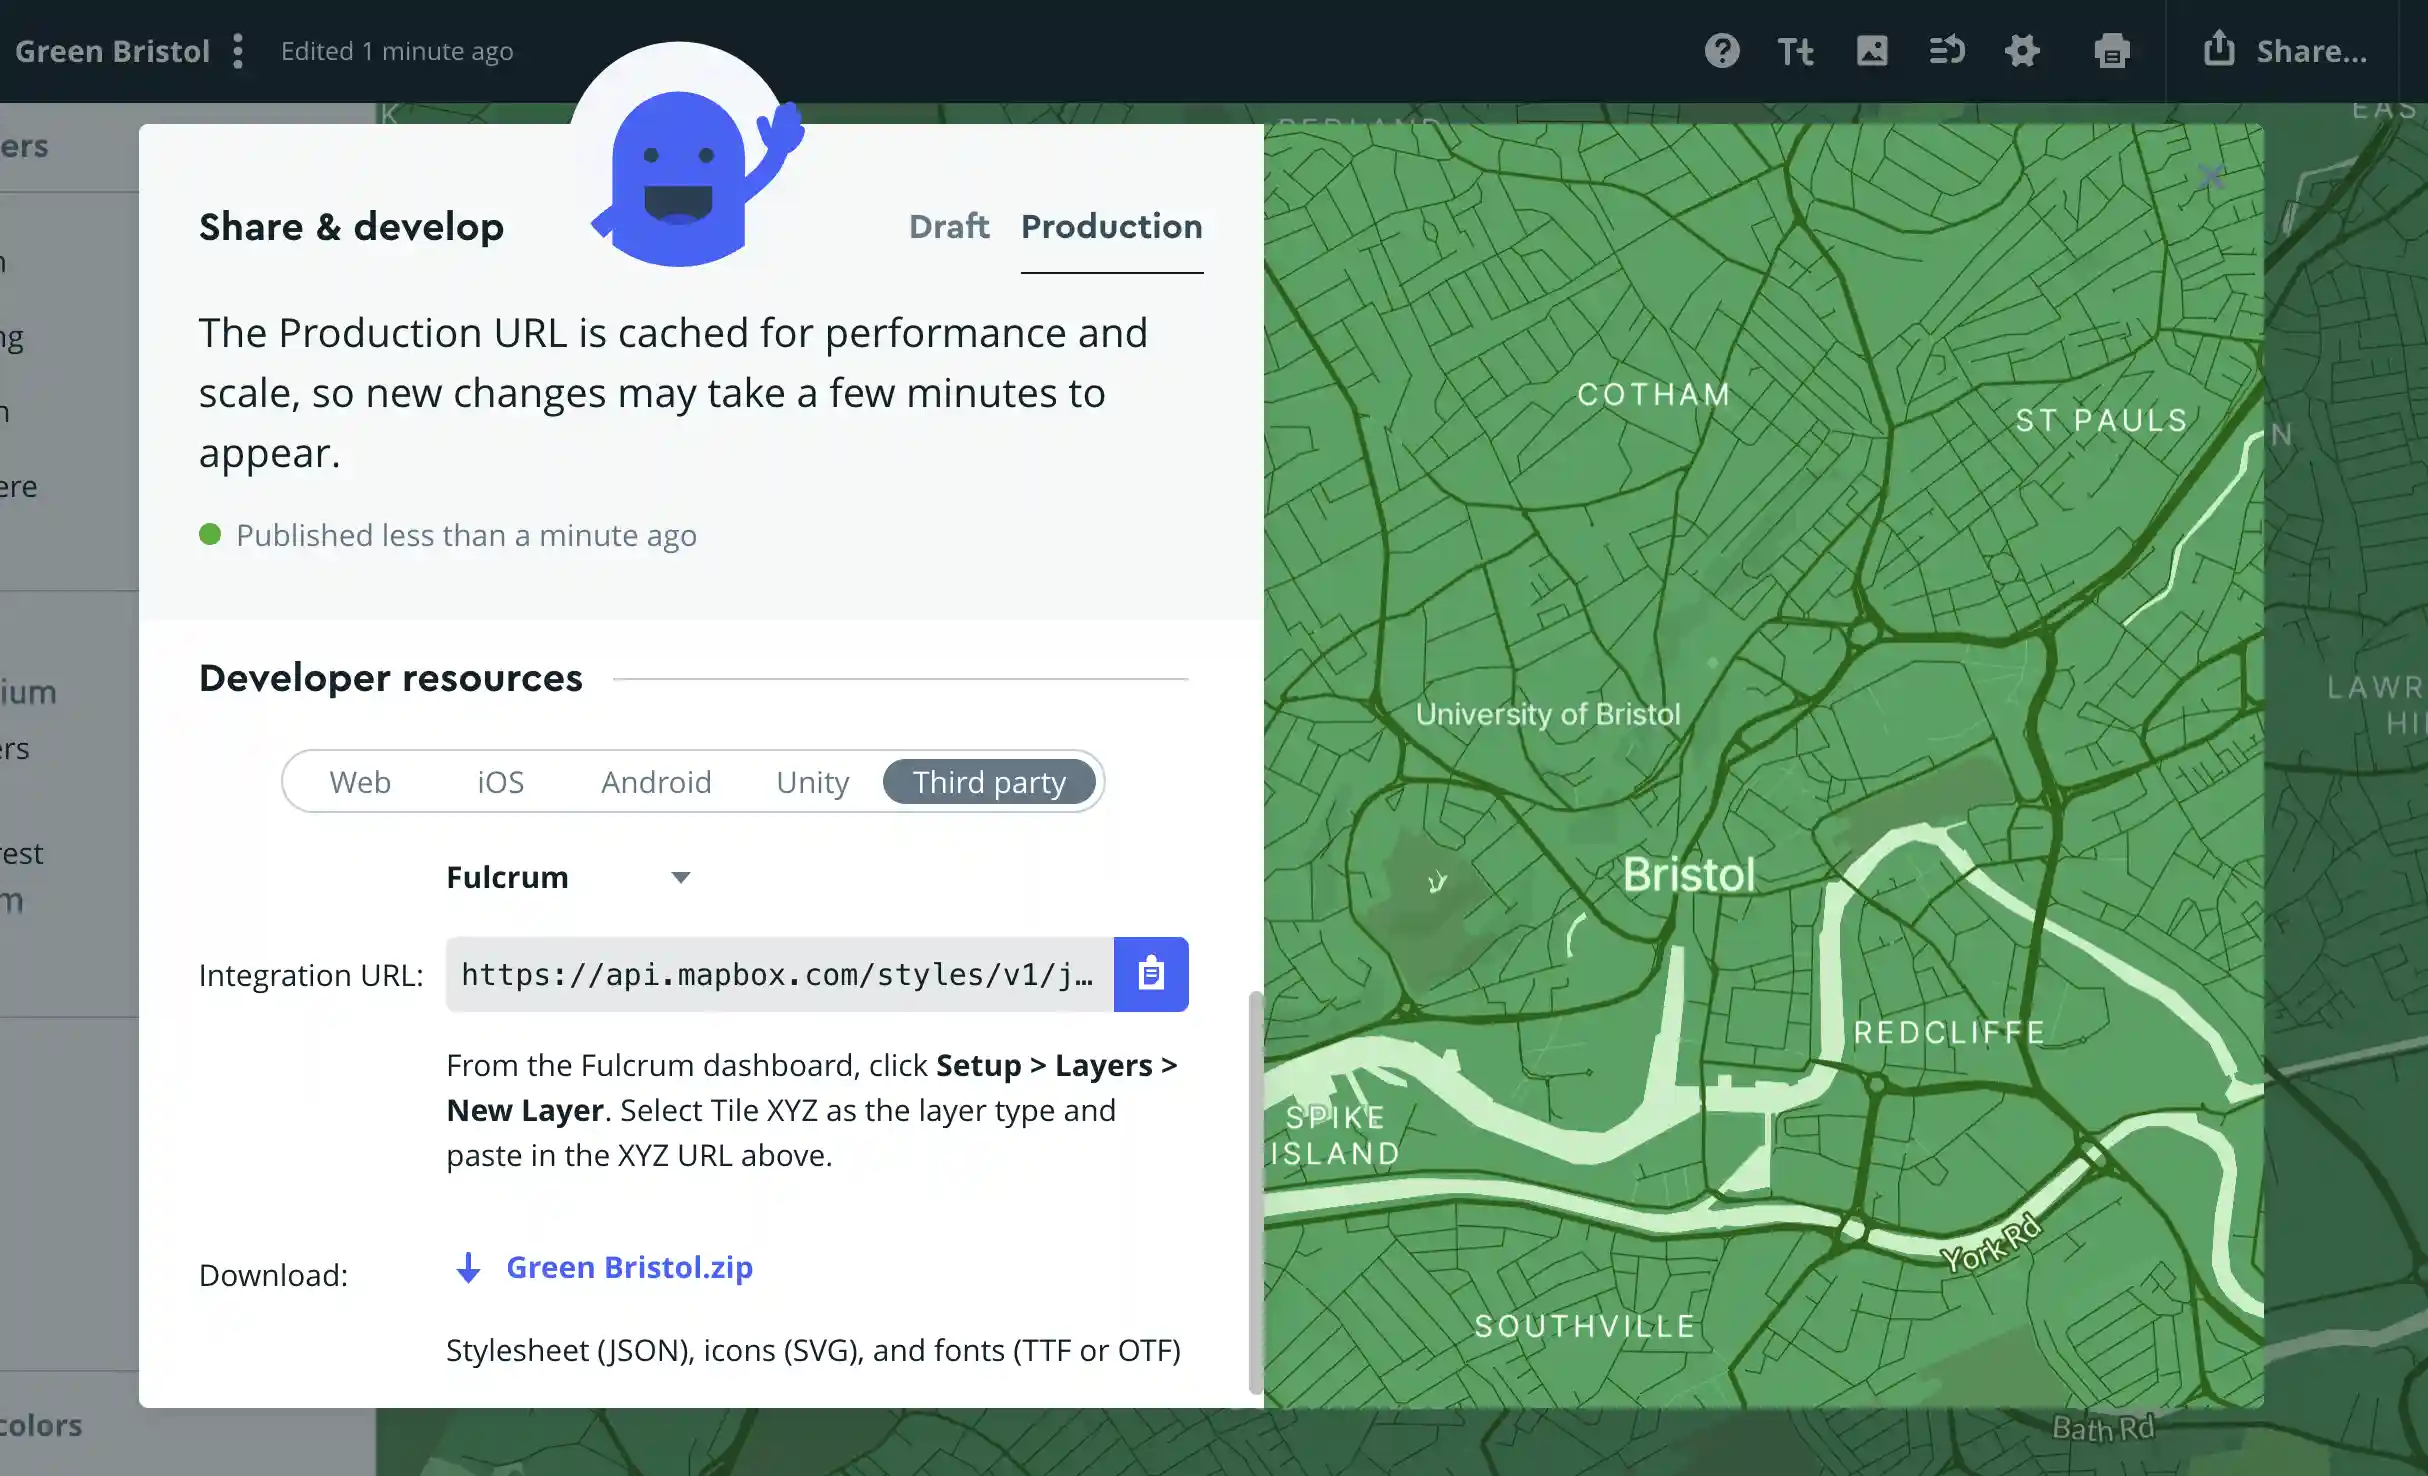
N.B. Don't share this URL with anyone else! It contains an access token that counts towards your API usage, so other people who access your map via this URL will cost you your API credits.
Calculate the bounds of your map tiles
We'll be querying Mapbox's API to download all of the map tiles within a desired range. I've written a basic Python script which iterates through the minimum and maximum tile co-ordinates for the section of the map, downloading each map image in turn, for a given set of zoom levels.
To work out the zoom levels, minimum and maximum x and y values, I've created a tool to help. You'll need two co-ordinate references, one for the top left corner of the map section, another for the bottom right.
Note that you can get away with downloading one or two zoom levels less than your desired maximum by letting Leaflet scale the last zoom level images based on the previous, causing slightly pixelated map images.
Run a script to download the tiles
Fork the template repository and change the initial variables in get_tiles.py with the map tile limits you'd like to download.
Follow the readme.md instructions for installation and downloading the map tiles. When you've downloaded your map tiles, commit them to the git repository.
Note that this download script only covers basic functionality, downloading tiles in sequence at about three per second. Feel free to create a MR to the template repository if you'd like to suggest a parallel solution or one with more error catching, etc.
Edit the index.html file so that the map tile URL points towards your GitHub account, and whatever you've named the repository.
L.tileLayer(
'https://{YOUR_USERNAME_HERE}.github.io/{REPOSITORY_NAME_HERE}/tiles/{z}/{x}/{y}.png',
{
minZoom: 1,
maxNativeZoom: 2,
maxZoom: 18,
attribution:
'© <a href="http://www.openstreetmap.org/copyright">OpenStreetMap | Mapbox</a>',
},
).addTo(map);
This is also a great time to adjust the min and maximum zoom to match that of the tiles you've downloaded. If you'd like the user to be able to zoom in further than what your tiles allow, set the maxNativeZoom to your tiles zoom limit, then edit the maxZoom to be one or two numbers larger. This way the user can zoom in on your map slightly more to see the last set of tiles closer up.
You can set the bounds of the map (so the user doesn't accidentally scroll into the calm oblivion) as follows:
const southWest = L.latLng(51.39, -2.417);
const northEast = L.latLng(51.53, -2.843);
const bounds = L.latLngBounds(southWest, northEast);

const map = L.map('map', { maxBounds: bounds }).setView(
  [51.44976, -2.59838], // set initial starting point
  12, // set initial zoom level
);
Commit and push the changes to GitHub, and activate GitHub Pages for your repository with the default settings.
Your website will shortly be live at https://{YOUR_USERNAME_HERE}.github.io/{REPOSITORY_NAME_HERE}/
Here's an example of a completed GitHub repository and index.html file.
And here's a live demo of the map I created using Mapbox & Leaflet.
Thank you for reading!
If you have any questions, issues or suggestions, please leave a comment on this site's GitHub repository.