Shadowbox is made of two parts: a web crawler to collect data about your site, and a Next.js app to display the results in a report.
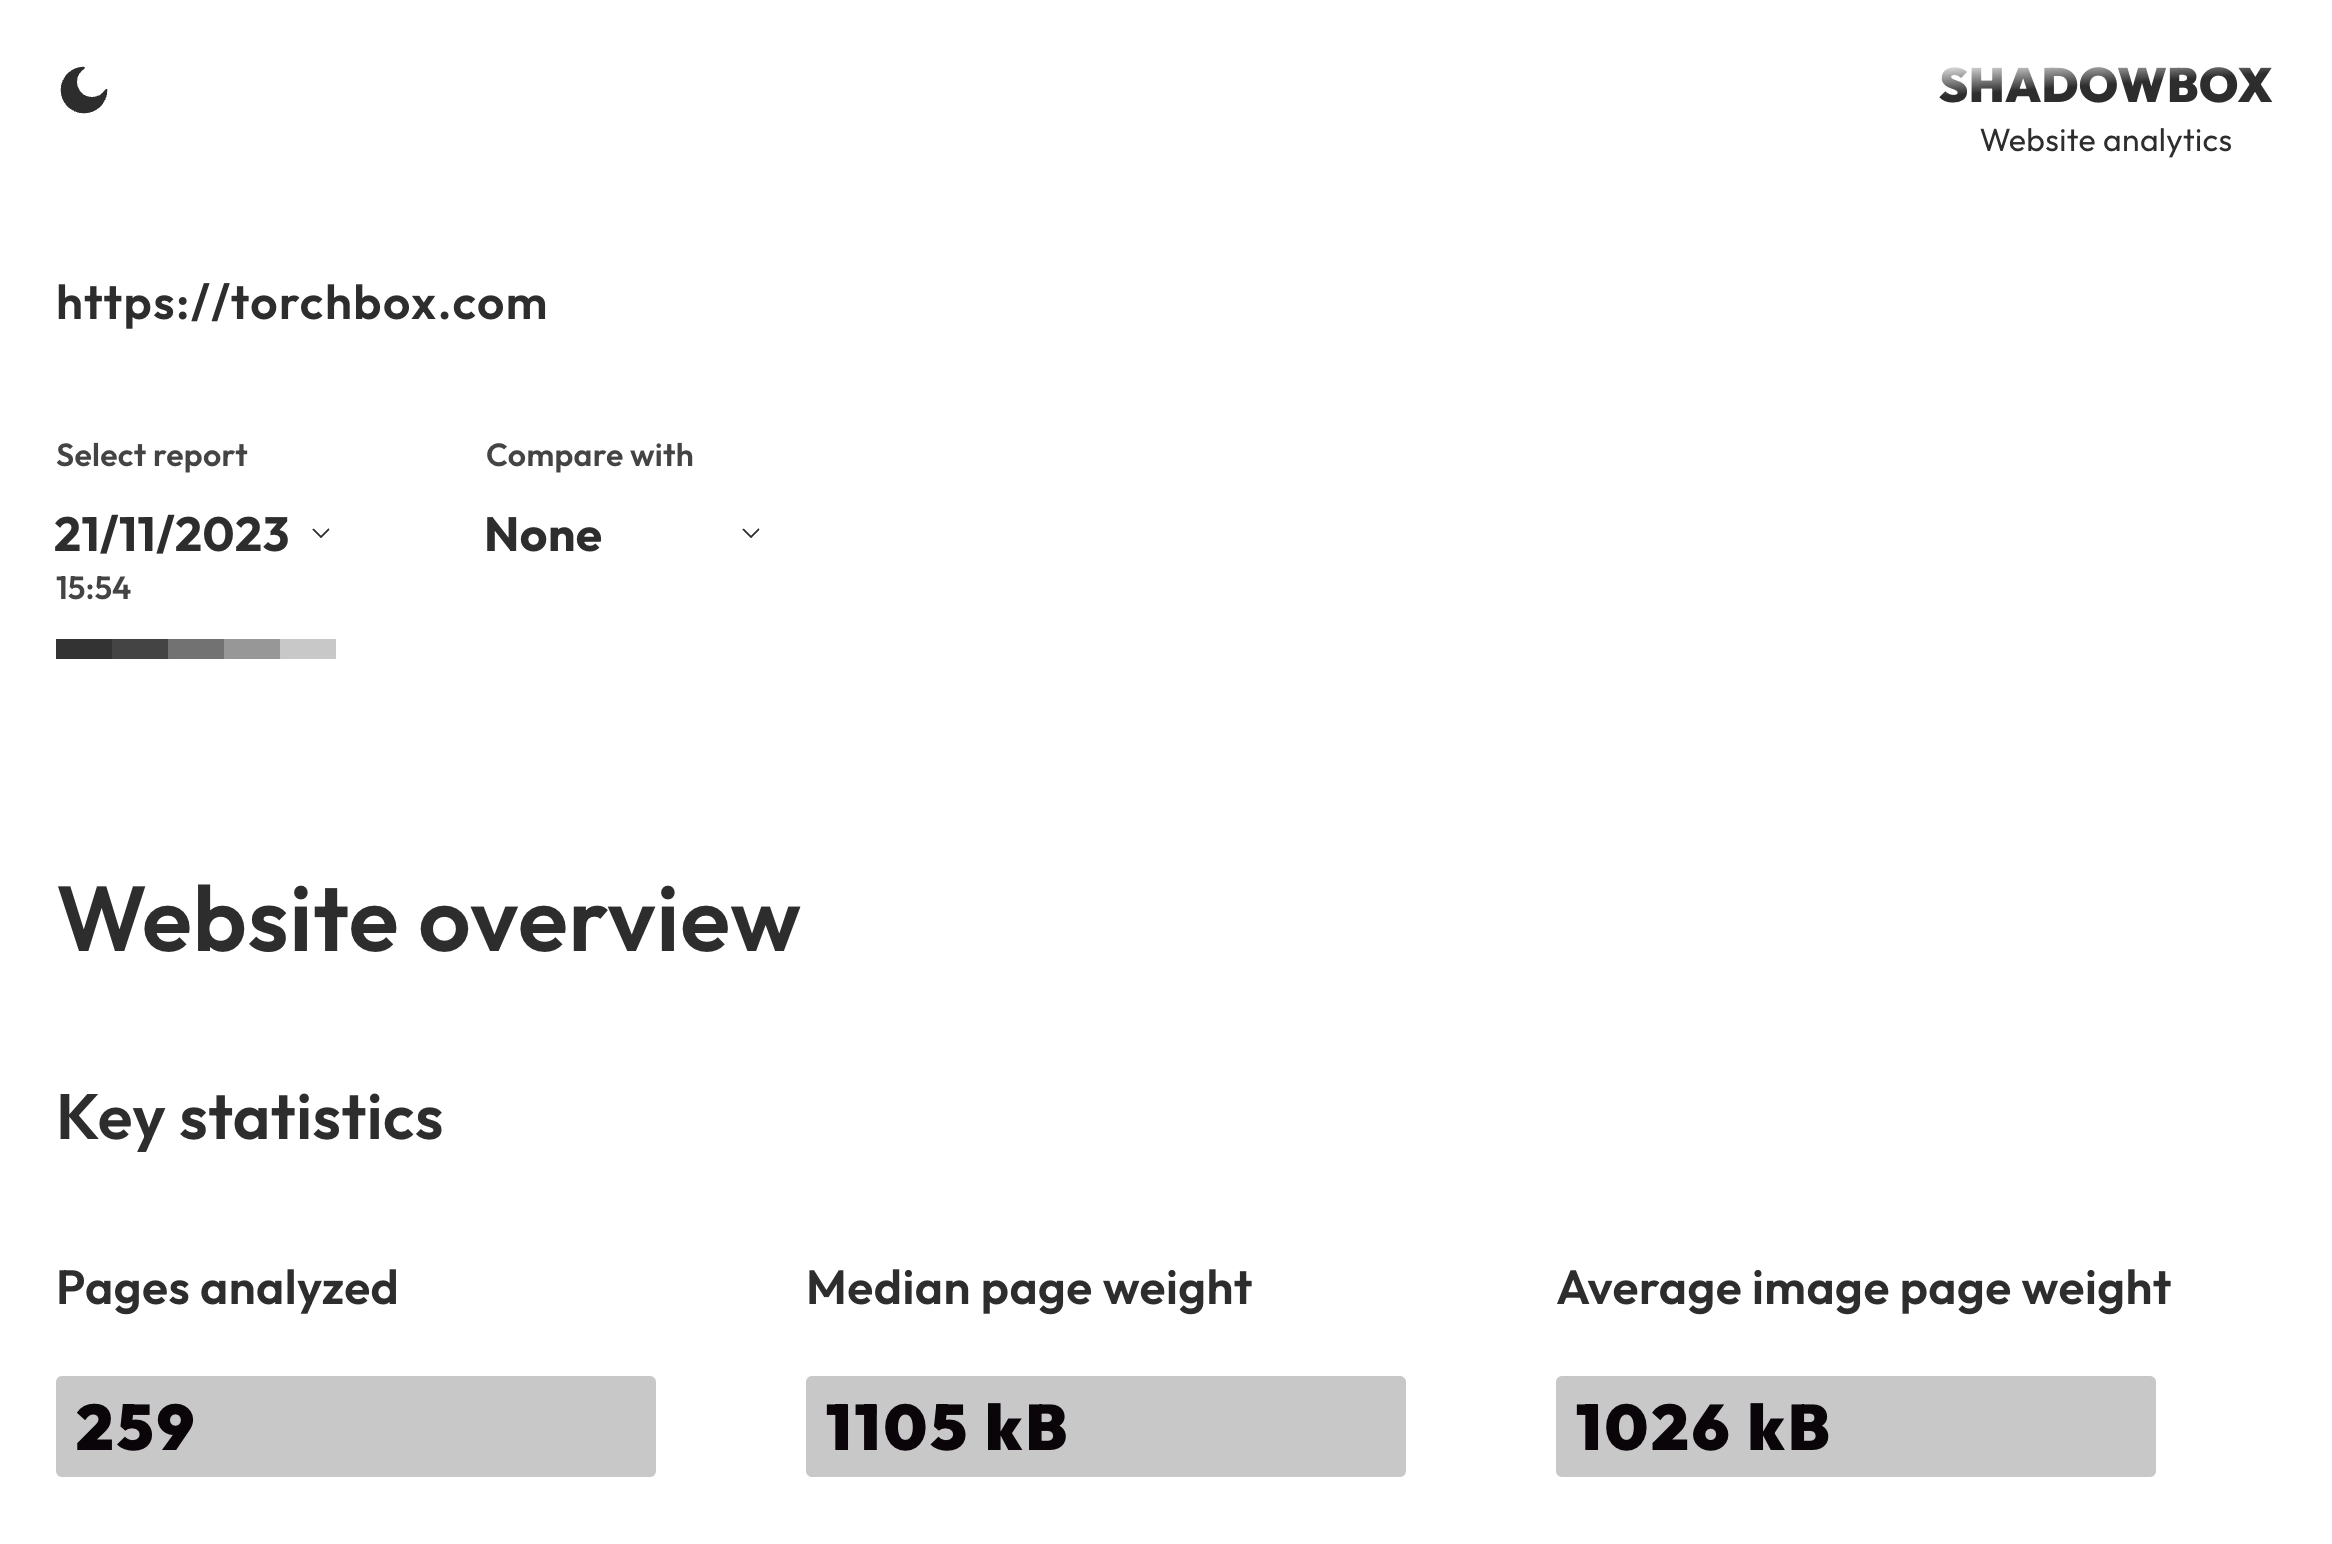
You can view an example report here, an overview of 259 pages hosted on torchbox.com. The source code for this project is available on GitHub.
Features
The report provides statistics on the sites performance as well as individual webpages. You can take multiple reports of a site at different times, and select which one to view from the dropdowns at the top of the page.
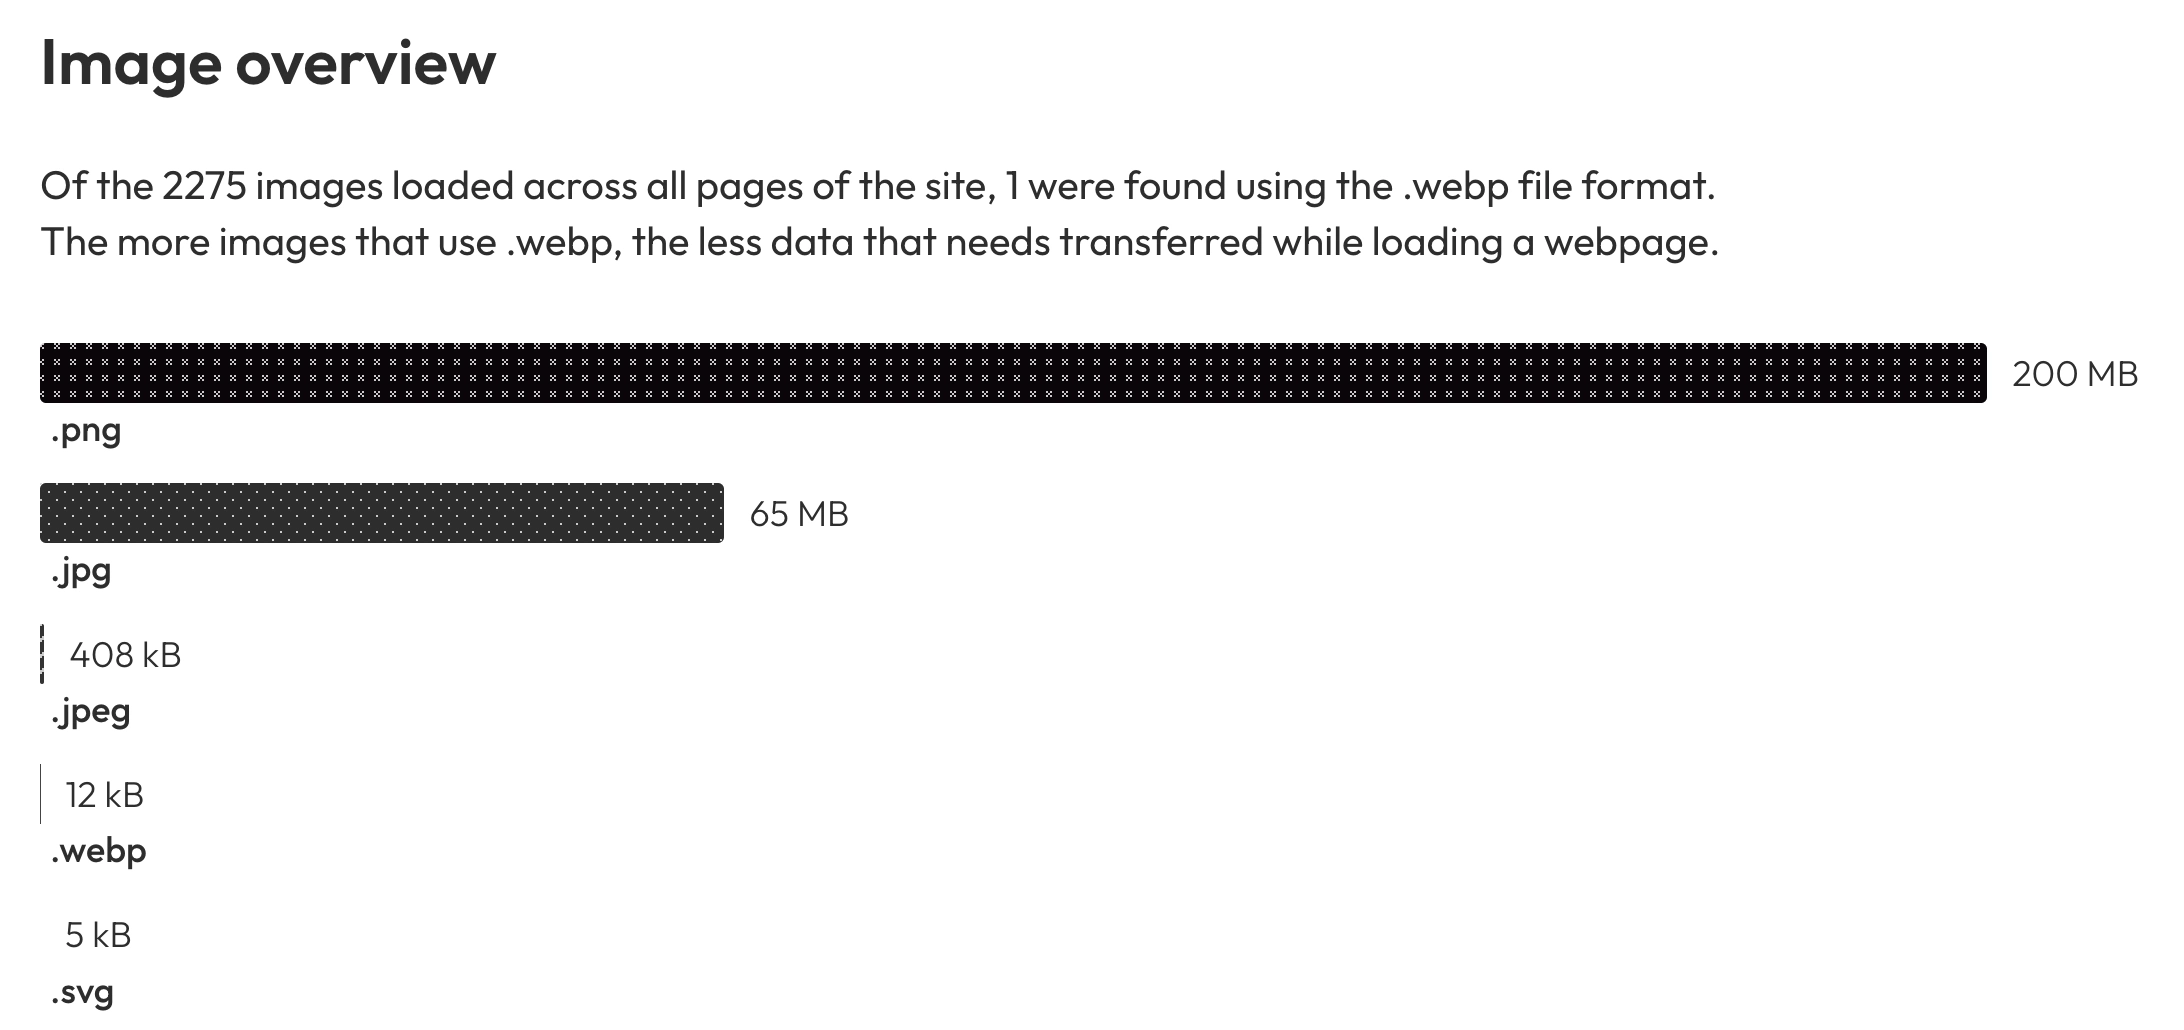
As well as key statistics, the report will offer recommendations in several areas relating to sustainability, such as using more efficient file formats for your images, or using fewer iFrames and font files.
As well as showing key sustainability indicators, the report highlights problematic pages from across the site in a 'Largest webpages by resource size' chart.
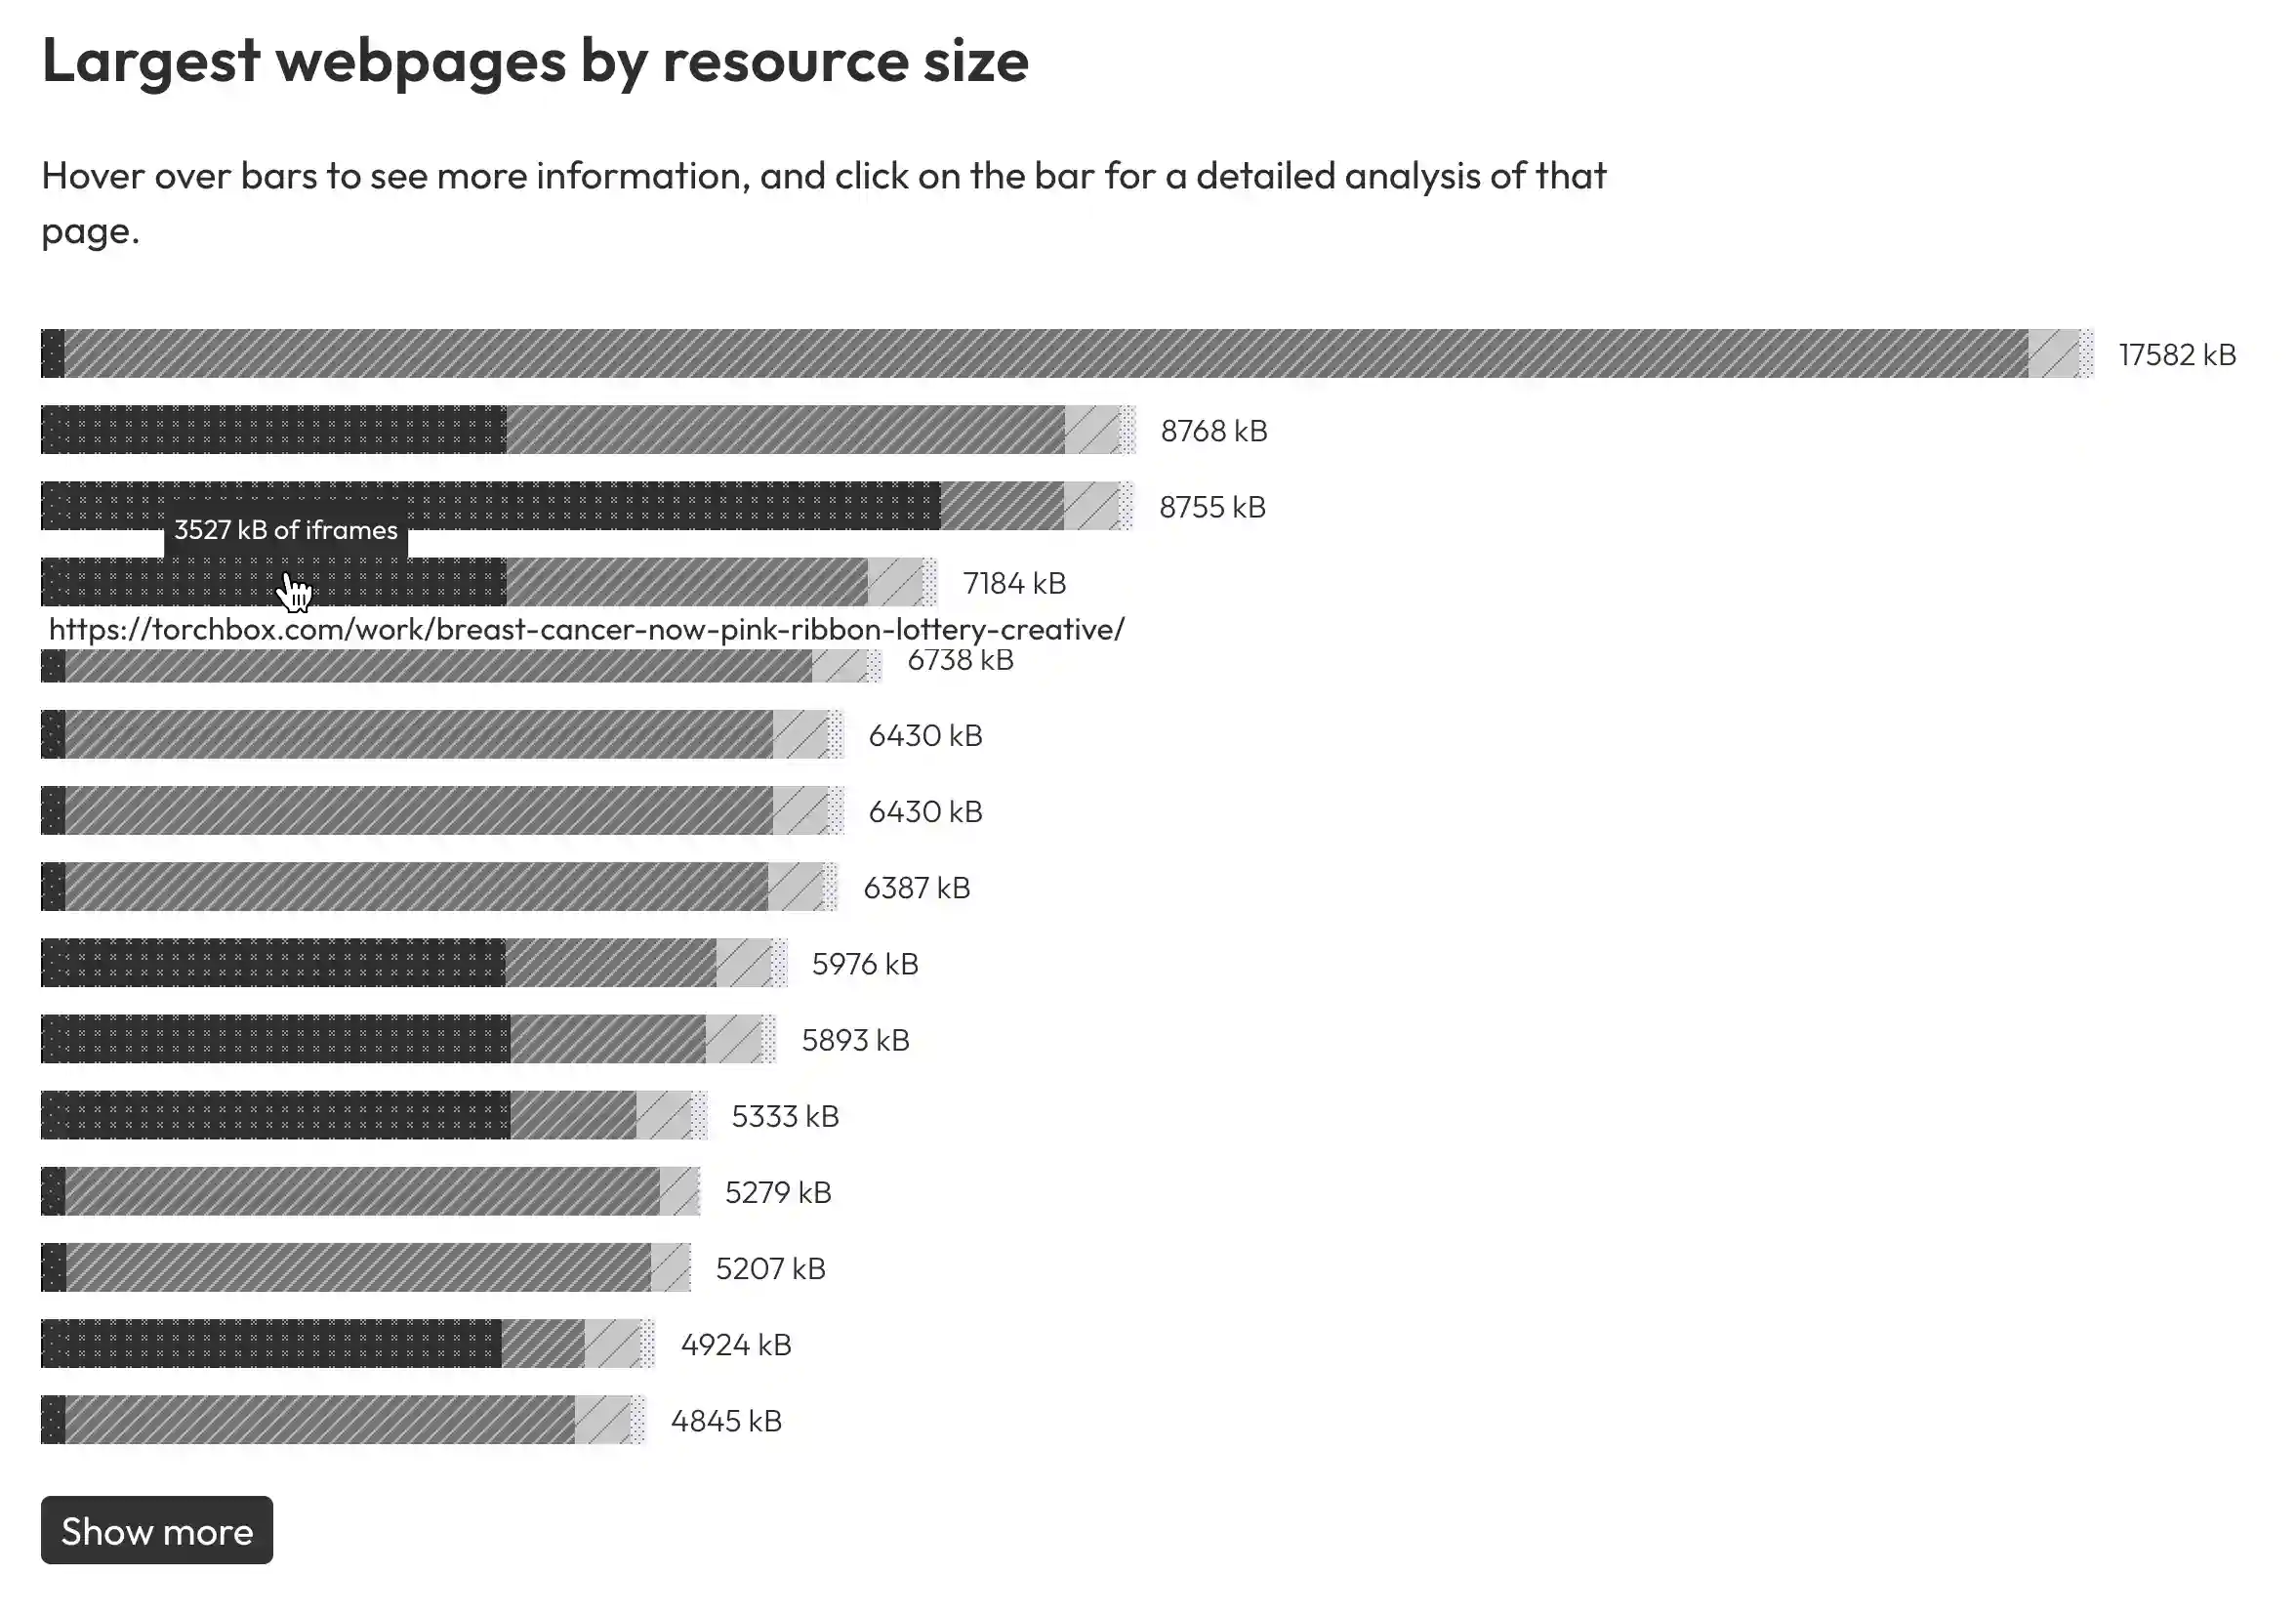
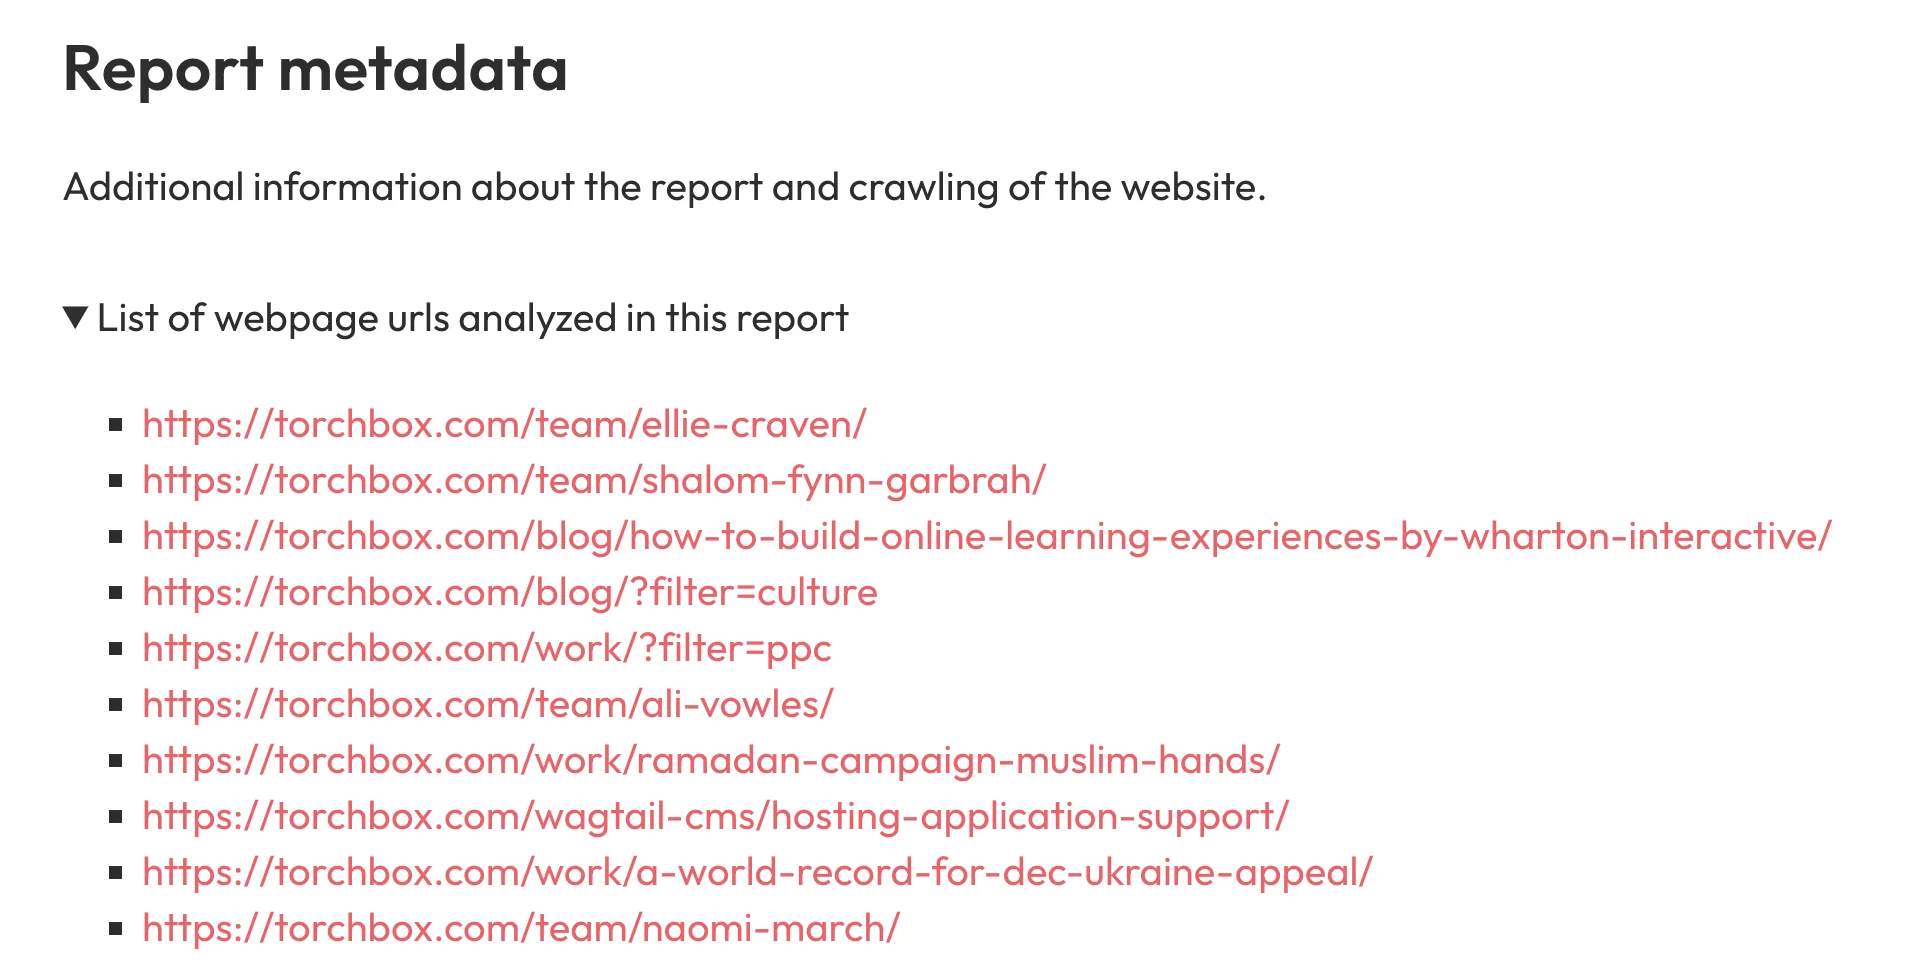
You can peek information about what resources are taking up the most space by hovering over segments of each bar. To view more information about a page, click on the bar in the chart or scroll down to the report metadata section.
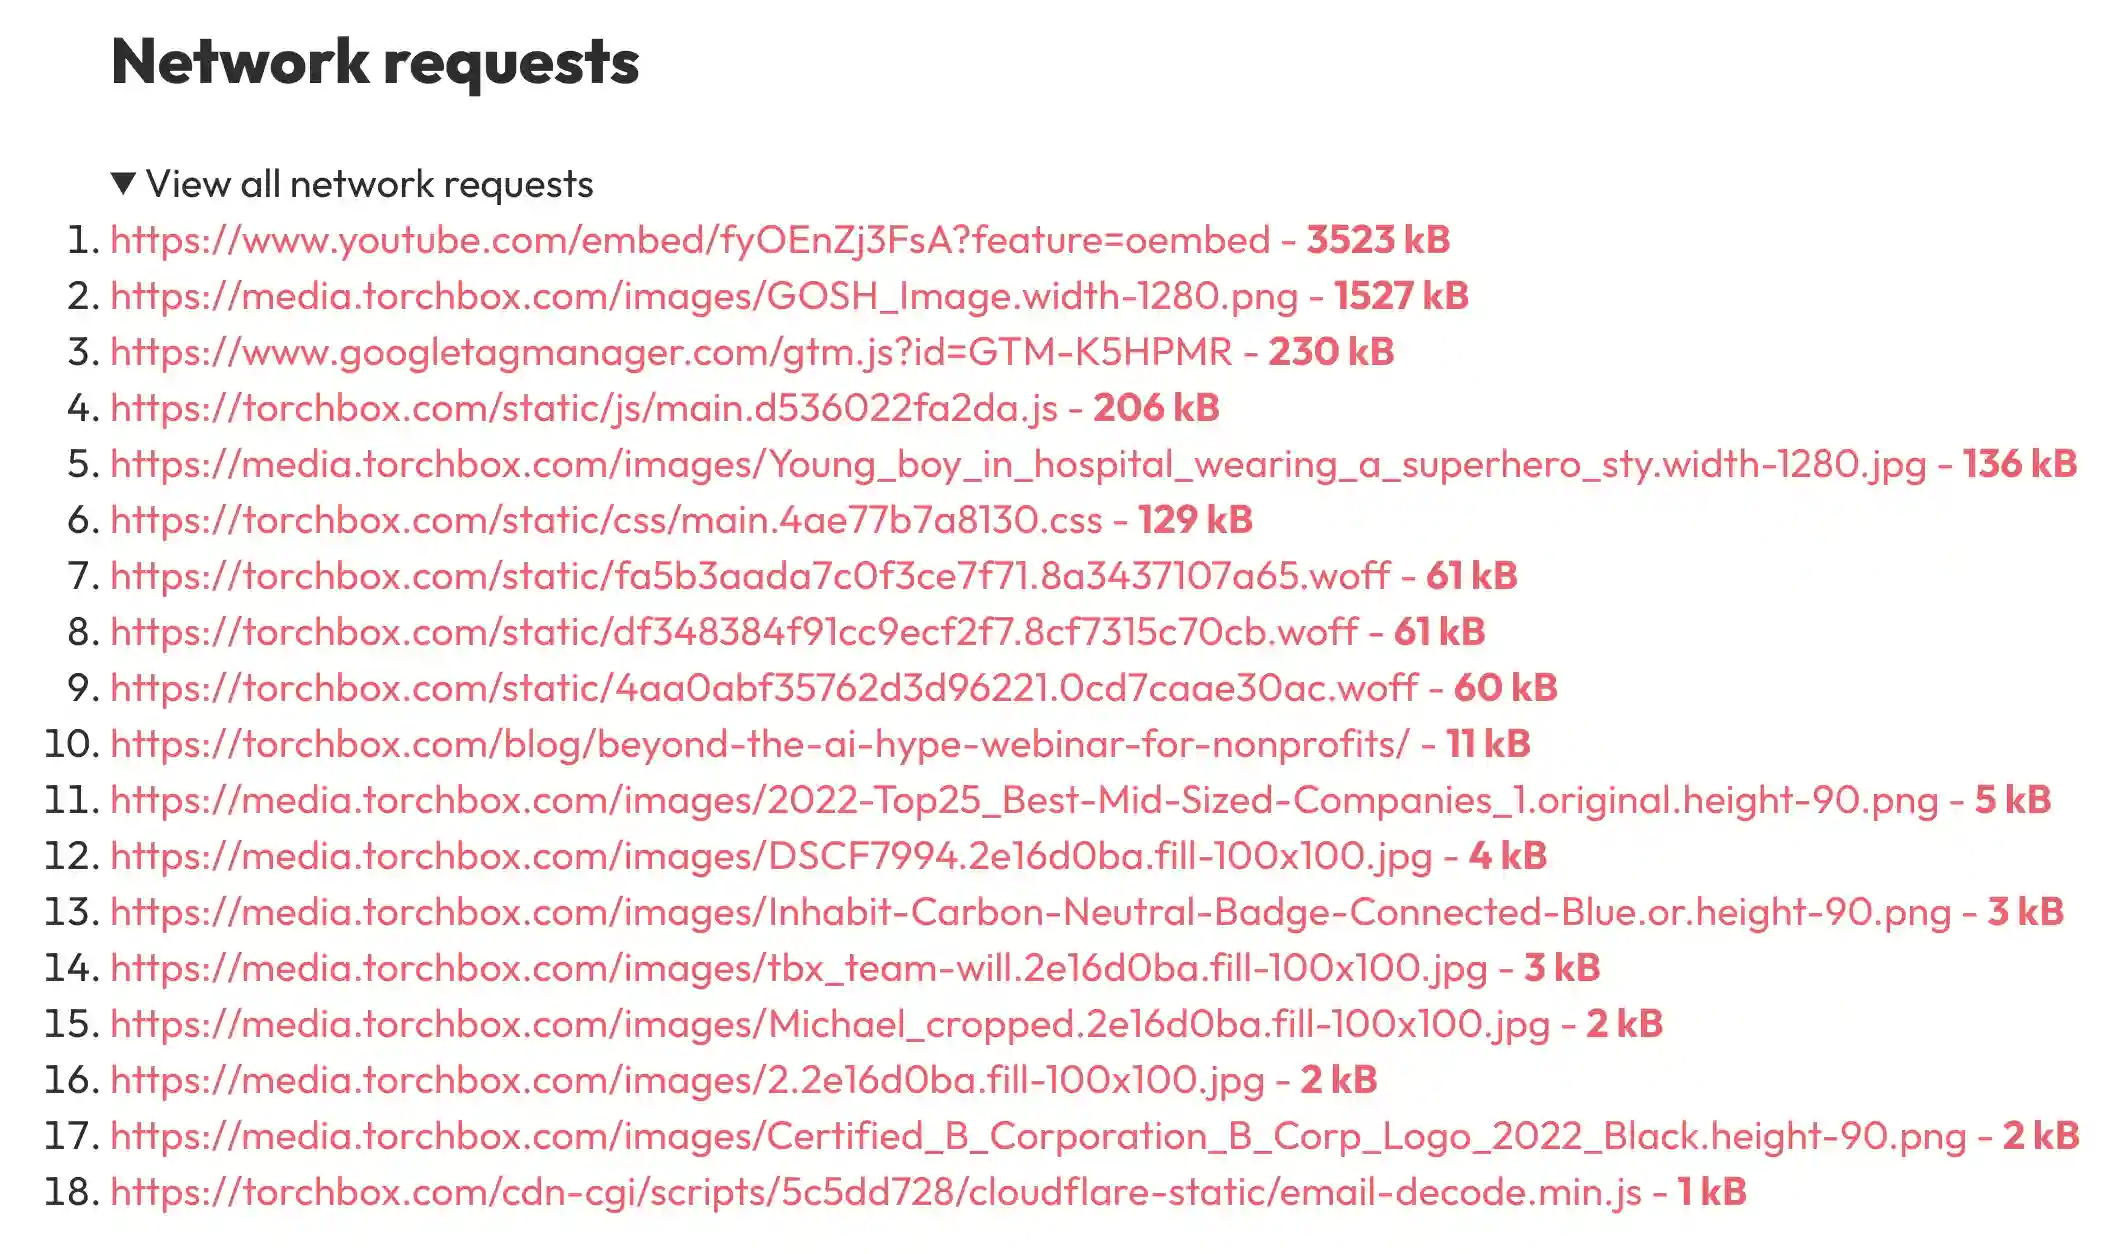
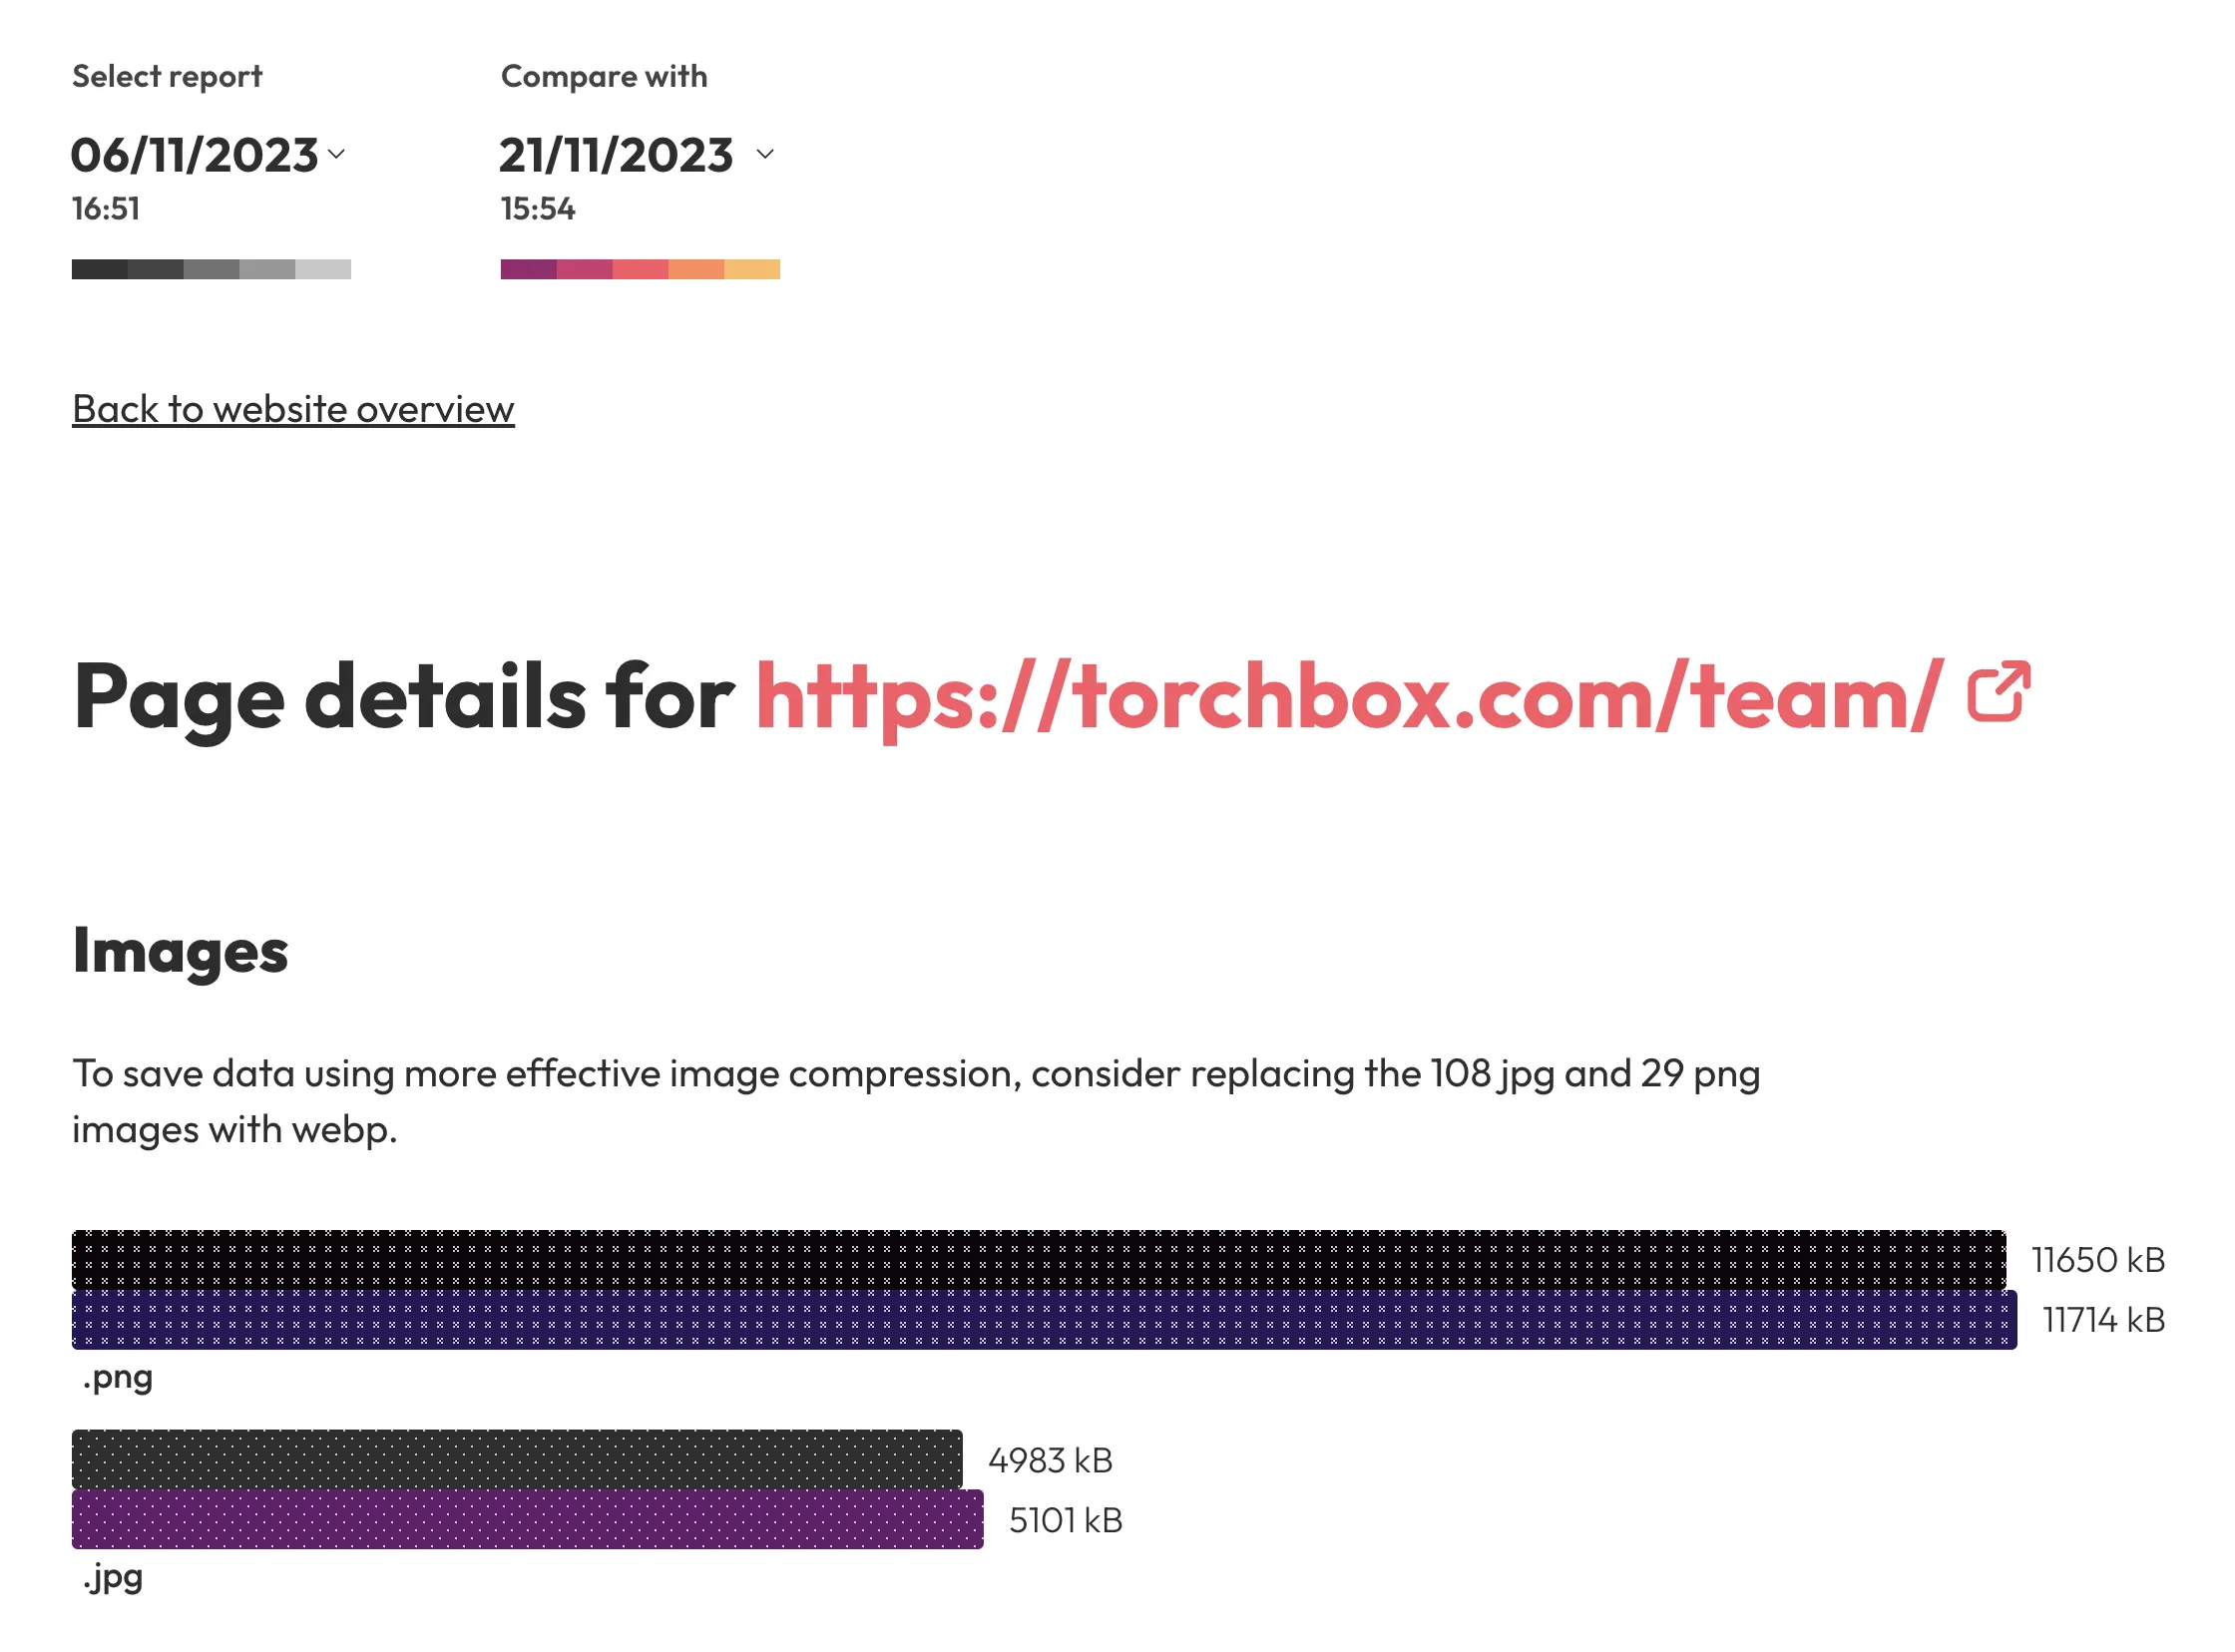
Individual page reports include recommendations on how to improve the images and fonts used to load the page as well as a full list of all network requests, ordered by size.
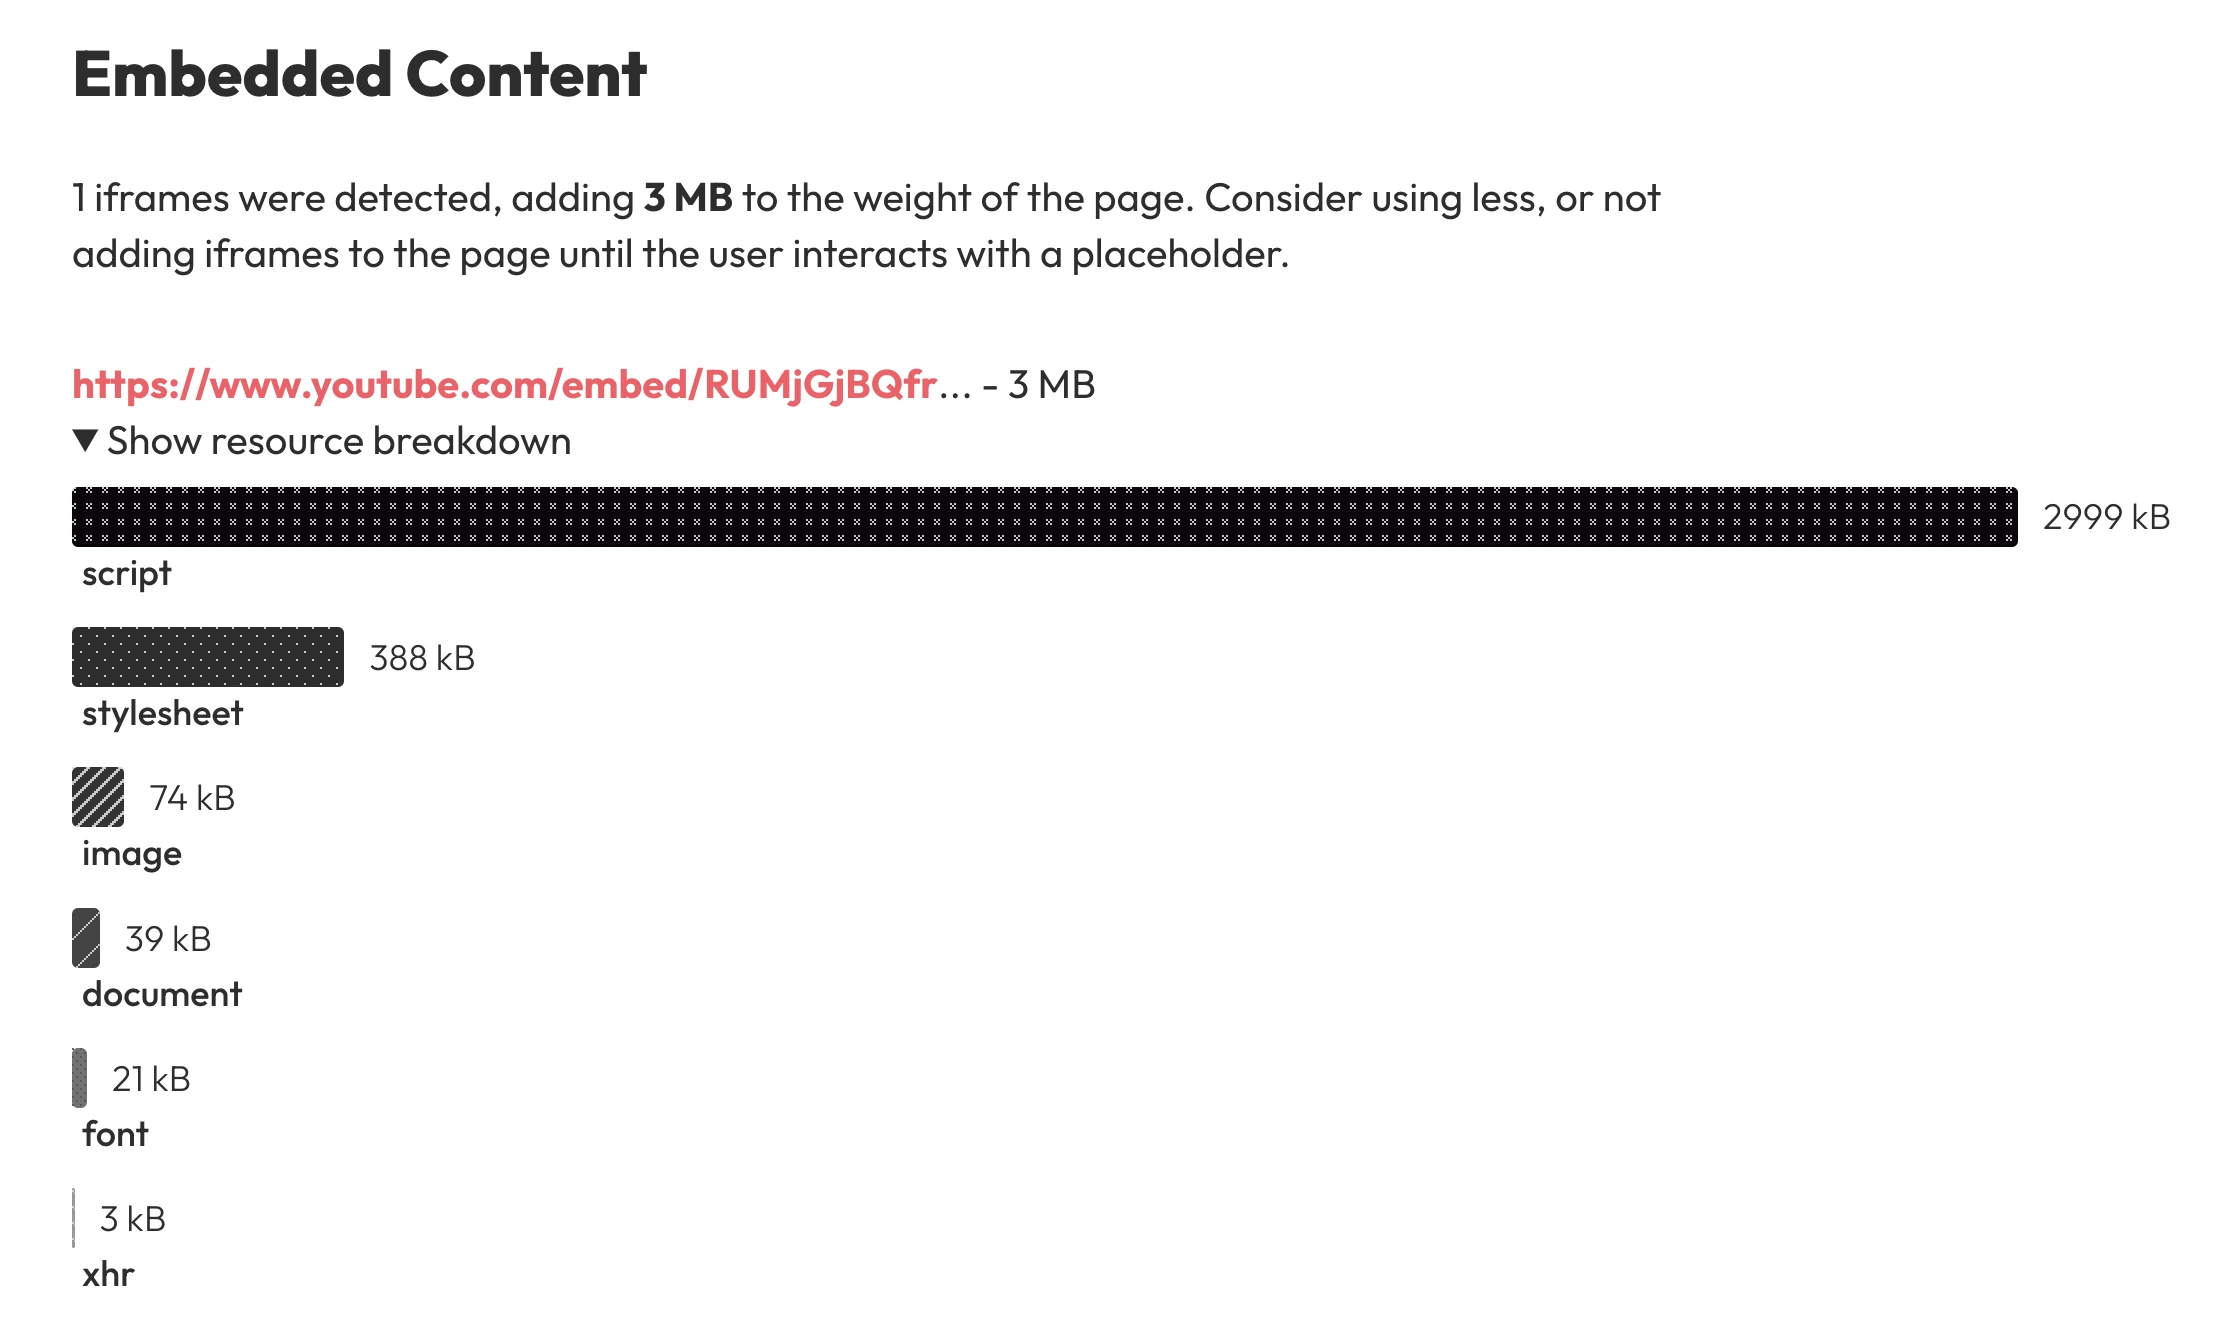
Where relevant, there's an additional report that covers any iFrame content loaded into that page.
Shadowbox also includes support for dark mode and the feature to compare the previous reports with future reports, distinguished by a different color scheme.
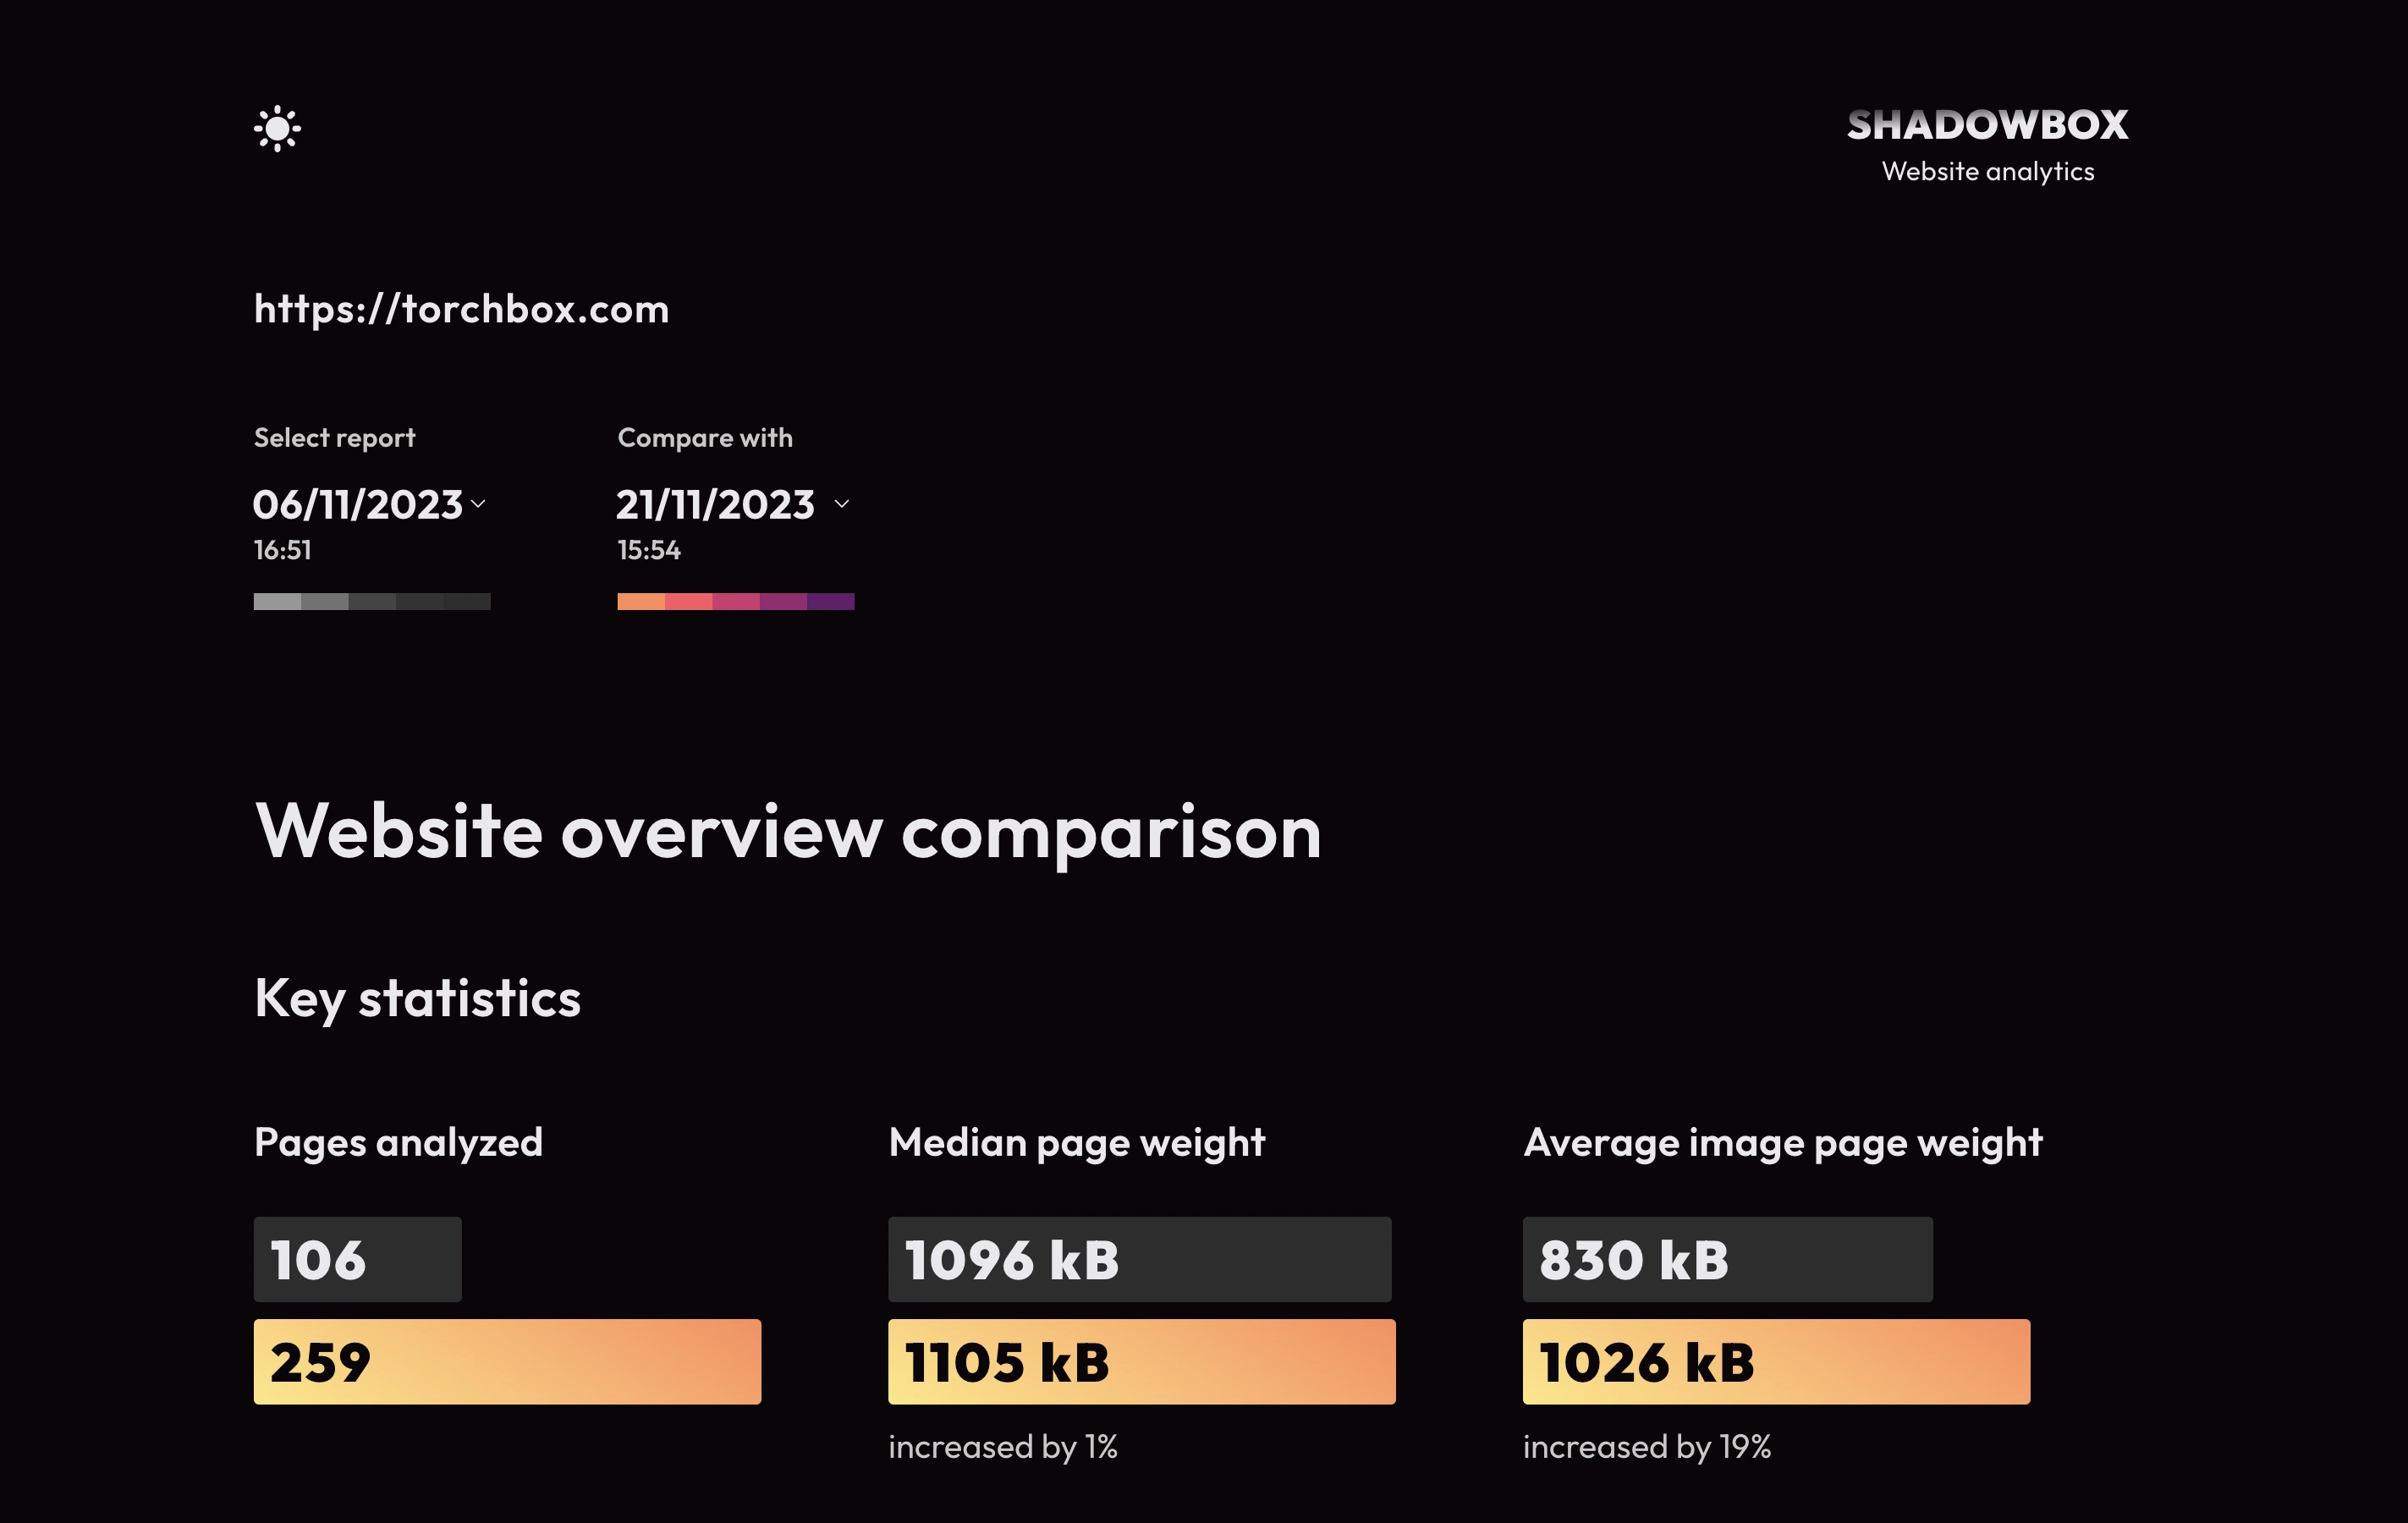
The comparison feature applies across the site, including in the individual page report. If webpage urls have changed, no compared data is shown for that page.
Technical details
The crawler
URLs of the site are gathered and navigated from a single root URL using Crawlee. Crawlee manages the use of Puppeteer, which controls the browser visiting each webpage.
The first thing the crawler does when visiting a webpage is scroll to the bottom of that page, rendering any lazy loaded content. When the crawler detects an iFrame, it gets added to a queue of sites to crawl after the main run. The iFrame is then factored into the total resource size for that page.
The data collected while crawling is processed and stored in JSON files. These files are committed directly to the repository, then are later read and displayed by the Next.js app.
If you'd like to try running the crawler for yourself, I've added instructions in the GitHub repositories readme.
Data processing
This project had some difficulty gathering realistic network request transfer sizes. The Web API that returns these values (window.performance.getEntries()) frequently gave an incorrect or missing file size.
To resolve this problem, an additional script runs after the main site crawl to download every network request, calculating their sizes. This creates a dictionary of request sizes that can be referred to when calculating total page weights or listing all the requests for an individual page.
After all the data exploration and downloading has been completed (gathering pages, iframes and network resource sizes), all of the data for the run is assigned to a report id and stored under that report id in the file system. The folder structure is as follows:
- /[report-id]
- iframeRequestSizes.json
- iframes.json
- metadata.json
- networkRequestsSummary.json
- requestSizes.json
- /[page-id]
- networkRequests.json
- pageMetadata.json
Each page folder contains network request information and basic metadata useful for the report, such as its id and url information. For the JSON files that are direct children of the report folder,
requestSizes.jsonandiframeRequestSizes.jsoncontain all the network requests made while crawling the site and their accurate size. These files are referred to when creating the network request summary and page network request lists.networkRequestSummary.jsoncontains all the data to be displayed on the report overview page, with network request sizes tallied by asset type for convenience.iframes.jsoncontains the iFrame data that is fed into individual page reportsmetadata.jsonstores a list of URLs mapped to their page ids in a file, as well as some information about the site crawl itself.
The Next.js report
This report has been built with Next.js v14 using the app router, with all pages rendered server side. This architecture, and especially the use of CSS color variables when adding dark mode, was inspired by Josh W. Comeau's Joy of React course. All charts, components, styles added are custom made.
The report comparison feature has had a large impact on how components for this site have been built. All charts and data visualization elements are able to accept two data input props, and can safely render one or both at the same time.
A cookie is set and removed with the compared report id when the report comparison dropdown is toggled. The server reads this cookie before rendering the page so it knows what report data to return. Otherwise, the server knows what report and page to render by referring to the url params. This follows the syntax of /[report-id]/[page-id].
Room for improvement
The GitHub repository is presented as a somewhat functional minimum viable product. Some important limitations to consider before using the code include:
-
This software has several known bugs still to be patched, including the inability to detect
.webpimages that have been sent with a.pngfilename. -
The crawler won't run against a site that has rate limiting protections from two many requests. There should be a configuration option to run the crawler at a slower or custom rate.
-
Webpages with query parameters but identical paths to a previous page are currently being crawled instead of ignored. The same applies for webpages with id hashes, e.g.
/#main-content -
The crawler has only been regularly tested on one or two sites, which doesn't reflect the broad diversity of website contents online. It's likely that some bugs will appear testing against a new site.
I'm happy to accept merge requests for bug fixes or new features, or otherwise help you with any issues you have when testing out the repository.
Acknowledgments
Helping with the design of the project, Millie Bowie provided advice regarding data visualization techniques and colors. Millie also suggested the name of this project, Shadowbox.
Thanks go to the wider developer community for creating NPM packages crawlee and next (alongside countless other dependencies), as well as Josh W. Comeau's Joy of React course whose Next.js tutorials I followed while creating this site.